Immigrants from Russia vs Syrian Single Female Poverty
COMPARE
Immigrants from Russia
Syrian
Single Female Poverty
Single Female Poverty Comparison
Immigrants from Russia
Syrians
19.4%
SINGLE FEMALE POVERTY
99.3/ 100
METRIC RATING
77th/ 347
METRIC RANK
20.3%
SINGLE FEMALE POVERTY
90.4/ 100
METRIC RATING
140th/ 347
METRIC RANK
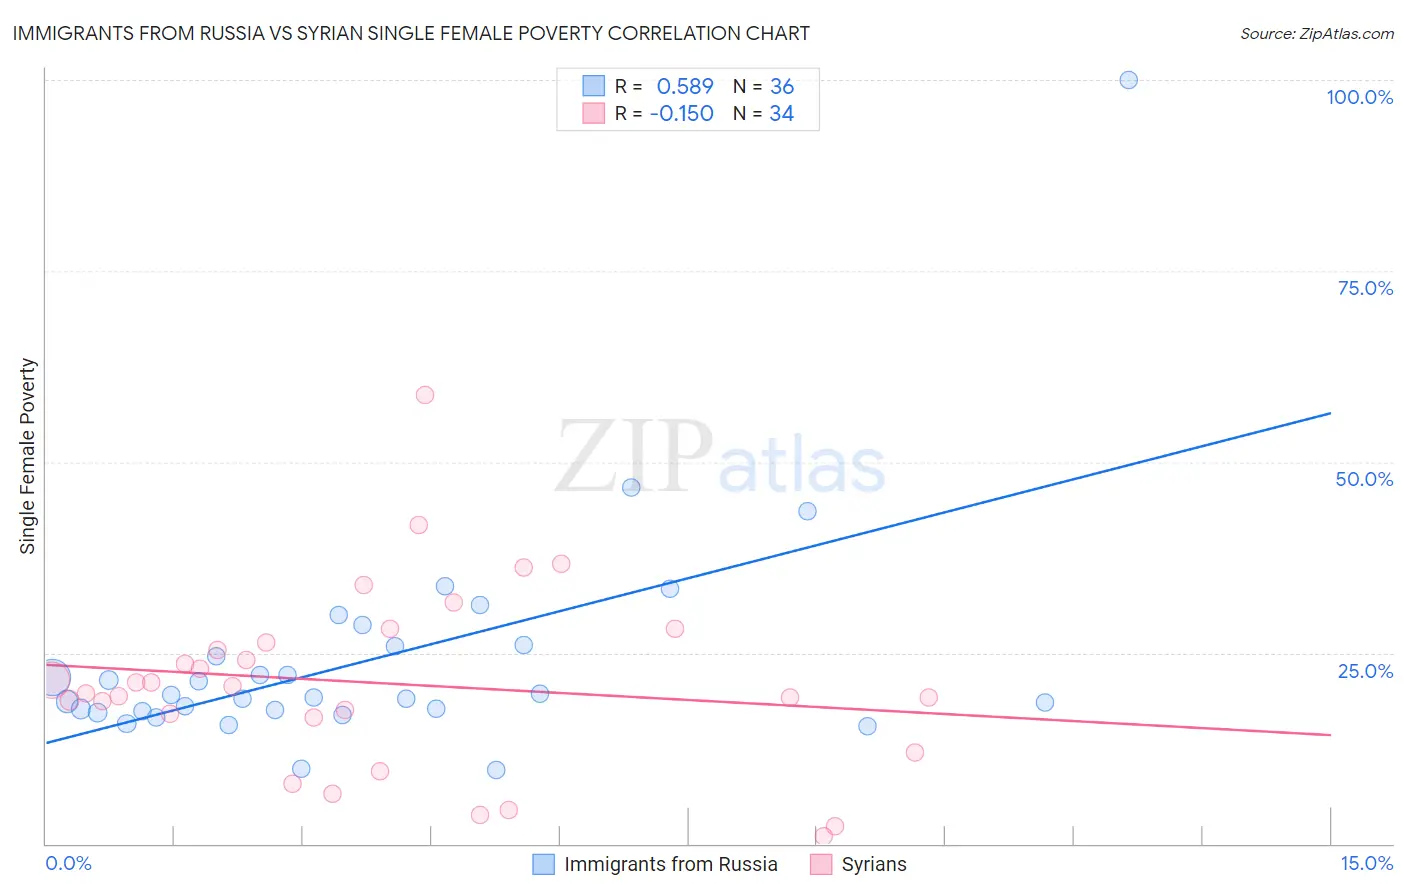
Immigrants from Russia vs Syrian Single Female Poverty Correlation Chart
The statistical analysis conducted on geographies consisting of 342,303,580 people shows a substantial positive correlation between the proportion of Immigrants from Russia and poverty level among single females in the United States with a correlation coefficient (R) of 0.589 and weighted average of 19.4%. Similarly, the statistical analysis conducted on geographies consisting of 263,006,420 people shows a poor negative correlation between the proportion of Syrians and poverty level among single females in the United States with a correlation coefficient (R) of -0.150 and weighted average of 20.3%, a difference of 4.6%.
Single Female Poverty Correlation Summary
| Measurement | Immigrants from Russia | Syrian |
| Minimum | 9.7% | 0.97% |
| Maximum | 100.0% | 58.7% |
| Range | 90.3% | 57.7% |
| Mean | 24.2% | 21.0% |
| Median | 19.3% | 20.2% |
| Interquartile 25% (IQ1) | 17.4% | 16.6% |
| Interquartile 75% (IQ3) | 25.9% | 26.4% |
| Interquartile Range (IQR) | 8.5% | 9.8% |
| Standard Deviation (Sample) | 15.3% | 12.0% |
| Standard Deviation (Population) | 15.0% | 11.8% |
Similar Demographics by Single Female Poverty
Demographics Similar to Immigrants from Russia by Single Female Poverty
In terms of single female poverty, the demographic groups most similar to Immigrants from Russia are Albanian (19.4%, a difference of 0.070%), Immigrants from Sierra Leone (19.4%, a difference of 0.090%), Peruvian (19.4%, a difference of 0.13%), Immigrants from Australia (19.4%, a difference of 0.13%), and Immigrants from Scotland (19.4%, a difference of 0.15%).
| Demographics | Rating | Rank | Single Female Poverty |
| Immigrants | Jordan | 99.4 /100 | #70 | Exceptional 19.3% |
| Immigrants | South Eastern Asia | 99.4 /100 | #71 | Exceptional 19.3% |
| Immigrants | Latvia | 99.4 /100 | #72 | Exceptional 19.3% |
| Immigrants | Peru | 99.4 /100 | #73 | Exceptional 19.3% |
| Immigrants | Belarus | 99.4 /100 | #74 | Exceptional 19.3% |
| Immigrants | Turkey | 99.4 /100 | #75 | Exceptional 19.4% |
| Peruvians | 99.4 /100 | #76 | Exceptional 19.4% |
| Immigrants | Russia | 99.3 /100 | #77 | Exceptional 19.4% |
| Albanians | 99.3 /100 | #78 | Exceptional 19.4% |
| Immigrants | Sierra Leone | 99.3 /100 | #79 | Exceptional 19.4% |
| Immigrants | Australia | 99.3 /100 | #80 | Exceptional 19.4% |
| Immigrants | Scotland | 99.2 /100 | #81 | Exceptional 19.4% |
| Immigrants | Malaysia | 99.2 /100 | #82 | Exceptional 19.4% |
| Taiwanese | 99.2 /100 | #83 | Exceptional 19.4% |
| Immigrants | Sweden | 99.2 /100 | #84 | Exceptional 19.4% |
Demographics Similar to Syrians by Single Female Poverty
In terms of single female poverty, the demographic groups most similar to Syrians are Slovene (20.3%, a difference of 0.010%), Immigrants from Kuwait (20.3%, a difference of 0.010%), Immigrants from Nepal (20.3%, a difference of 0.050%), Immigrants from North America (20.3%, a difference of 0.15%), and Immigrants from Iraq (20.2%, a difference of 0.16%).
| Demographics | Rating | Rank | Single Female Poverty |
| Immigrants | England | 91.9 /100 | #133 | Exceptional 20.2% |
| Immigrants | Venezuela | 91.5 /100 | #134 | Exceptional 20.2% |
| Immigrants | Iraq | 91.2 /100 | #135 | Exceptional 20.2% |
| Immigrants | Canada | 91.2 /100 | #136 | Exceptional 20.2% |
| Immigrants | Nepal | 90.6 /100 | #137 | Exceptional 20.3% |
| Slovenes | 90.5 /100 | #138 | Exceptional 20.3% |
| Immigrants | Kuwait | 90.4 /100 | #139 | Exceptional 20.3% |
| Syrians | 90.4 /100 | #140 | Exceptional 20.3% |
| Immigrants | North America | 89.5 /100 | #141 | Excellent 20.3% |
| Immigrants | Uganda | 89.1 /100 | #142 | Excellent 20.3% |
| Australians | 88.4 /100 | #143 | Excellent 20.3% |
| Immigrants | Uzbekistan | 88.3 /100 | #144 | Excellent 20.3% |
| Austrians | 85.8 /100 | #145 | Excellent 20.4% |
| Venezuelans | 85.5 /100 | #146 | Excellent 20.4% |
| South Africans | 85.3 /100 | #147 | Excellent 20.4% |