Immigrants from Russia vs Immigrants from Jordan Householder Income Under 25 years
COMPARE
Immigrants from Russia
Immigrants from Jordan
Householder Income Under 25 years
Householder Income Under 25 years Comparison
Immigrants from Russia
Immigrants from Jordan
$55,891
HOUSEHOLDER INCOME UNDER 25 YEARS
100.0/ 100
METRIC RATING
37th/ 347
METRIC RANK
$51,370
HOUSEHOLDER INCOME UNDER 25 YEARS
11.9/ 100
METRIC RATING
208th/ 347
METRIC RANK
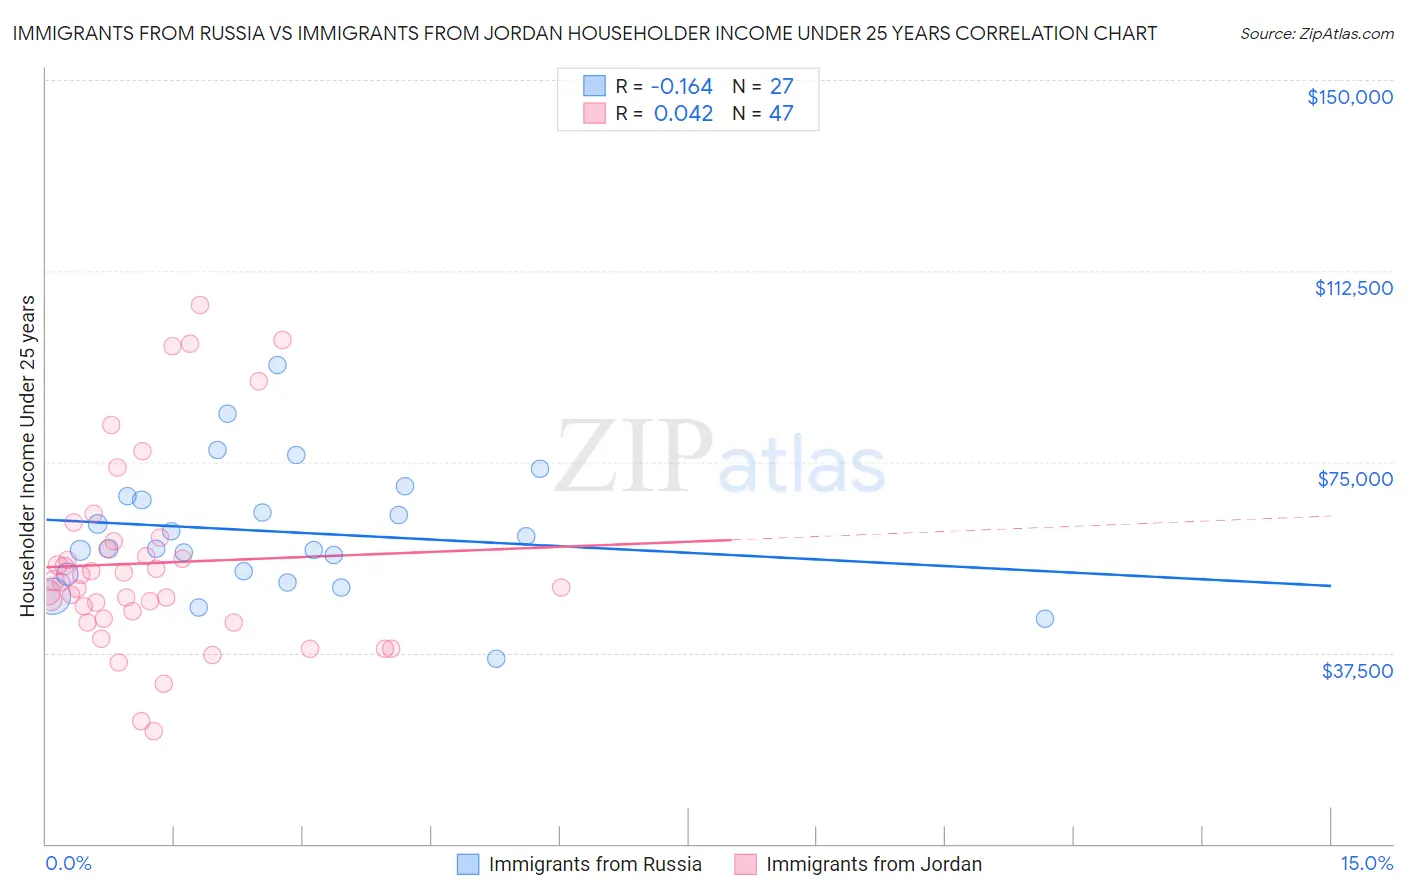
Immigrants from Russia vs Immigrants from Jordan Householder Income Under 25 years Correlation Chart
The statistical analysis conducted on geographies consisting of 295,410,688 people shows a poor negative correlation between the proportion of Immigrants from Russia and household income with householder under the age of 25 in the United States with a correlation coefficient (R) of -0.164 and weighted average of $55,891. Similarly, the statistical analysis conducted on geographies consisting of 163,486,233 people shows no correlation between the proportion of Immigrants from Jordan and household income with householder under the age of 25 in the United States with a correlation coefficient (R) of 0.042 and weighted average of $51,370, a difference of 8.8%.
Householder Income Under 25 years Correlation Summary
| Measurement | Immigrants from Russia | Immigrants from Jordan |
| Minimum | $36,250 | $22,102 |
| Maximum | $93,974 | $105,714 |
| Range | $57,724 | $83,612 |
| Mean | $61,278 | $55,122 |
| Median | $57,969 | $51,314 |
| Interquartile 25% (IQ1) | $52,911 | $44,180 |
| Interquartile 75% (IQ3) | $68,185 | $59,421 |
| Interquartile Range (IQR) | $15,274 | $15,241 |
| Standard Deviation (Sample) | $12,683 | $18,968 |
| Standard Deviation (Population) | $12,446 | $18,765 |
Similar Demographics by Householder Income Under 25 years
Demographics Similar to Immigrants from Russia by Householder Income Under 25 years
In terms of householder income under 25 years, the demographic groups most similar to Immigrants from Russia are Immigrants from Iran ($55,880, a difference of 0.020%), Tlingit-Haida ($55,914, a difference of 0.040%), Immigrants from Israel ($55,913, a difference of 0.040%), Immigrants from Japan ($55,932, a difference of 0.070%), and Inupiat ($55,935, a difference of 0.080%).
| Demographics | Rating | Rank | Householder Income Under 25 years |
| Immigrants | Moldova | 100.0 /100 | #30 | Exceptional $56,168 |
| Vietnamese | 100.0 /100 | #31 | Exceptional $56,127 |
| Peruvians | 100.0 /100 | #32 | Exceptional $56,052 |
| Inupiat | 100.0 /100 | #33 | Exceptional $55,935 |
| Immigrants | Japan | 100.0 /100 | #34 | Exceptional $55,932 |
| Tlingit-Haida | 100.0 /100 | #35 | Exceptional $55,914 |
| Immigrants | Israel | 100.0 /100 | #36 | Exceptional $55,913 |
| Immigrants | Russia | 100.0 /100 | #37 | Exceptional $55,891 |
| Immigrants | Iran | 100.0 /100 | #38 | Exceptional $55,880 |
| Immigrants | Belarus | 100.0 /100 | #39 | Exceptional $55,743 |
| Immigrants | Greece | 100.0 /100 | #40 | Exceptional $55,727 |
| Immigrants | Guyana | 100.0 /100 | #41 | Exceptional $55,726 |
| Immigrants | Korea | 100.0 /100 | #42 | Exceptional $55,716 |
| Immigrants | South Eastern Asia | 100.0 /100 | #43 | Exceptional $55,714 |
| Paraguayans | 100.0 /100 | #44 | Exceptional $55,614 |
Demographics Similar to Immigrants from Jordan by Householder Income Under 25 years
In terms of householder income under 25 years, the demographic groups most similar to Immigrants from Jordan are South African ($51,383, a difference of 0.020%), Cape Verdean ($51,387, a difference of 0.030%), Immigrants from Latin America ($51,387, a difference of 0.030%), Syrian ($51,353, a difference of 0.030%), and Immigrants from Ghana ($51,333, a difference of 0.070%).
| Demographics | Rating | Rank | Householder Income Under 25 years |
| British | 14.9 /100 | #201 | Poor $51,477 |
| Immigrants | Guatemala | 14.0 /100 | #202 | Poor $51,447 |
| Immigrants | Cameroon | 13.6 /100 | #203 | Poor $51,433 |
| Czechs | 13.2 /100 | #204 | Poor $51,421 |
| Cape Verdeans | 12.3 /100 | #205 | Poor $51,387 |
| Immigrants | Latin America | 12.3 /100 | #206 | Poor $51,387 |
| South Africans | 12.2 /100 | #207 | Poor $51,383 |
| Immigrants | Jordan | 11.9 /100 | #208 | Poor $51,370 |
| Syrians | 11.4 /100 | #209 | Poor $51,353 |
| Immigrants | Ghana | 10.9 /100 | #210 | Poor $51,333 |
| Irish | 10.6 /100 | #211 | Poor $51,317 |
| Immigrants | Panama | 9.7 /100 | #212 | Tragic $51,278 |
| Dutch | 9.4 /100 | #213 | Tragic $51,265 |
| Zimbabweans | 9.3 /100 | #214 | Tragic $51,259 |
| Icelanders | 9.1 /100 | #215 | Tragic $51,247 |