Immigrants from Canada vs Immigrants from Oceania Seniors Poverty Over the Age of 65
COMPARE
Immigrants from Canada
Immigrants from Oceania
Seniors Poverty Over the Age of 65
Seniors Poverty Over the Age of 65 Comparison
Immigrants from Canada
Immigrants from Oceania
9.8%
SENIORS POVERTY OVER THE AGE OF 65
99.0/ 100
METRIC RATING
59th/ 347
METRIC RANK
10.4%
SENIORS POVERTY OVER THE AGE OF 65
88.4/ 100
METRIC RATING
130th/ 347
METRIC RANK
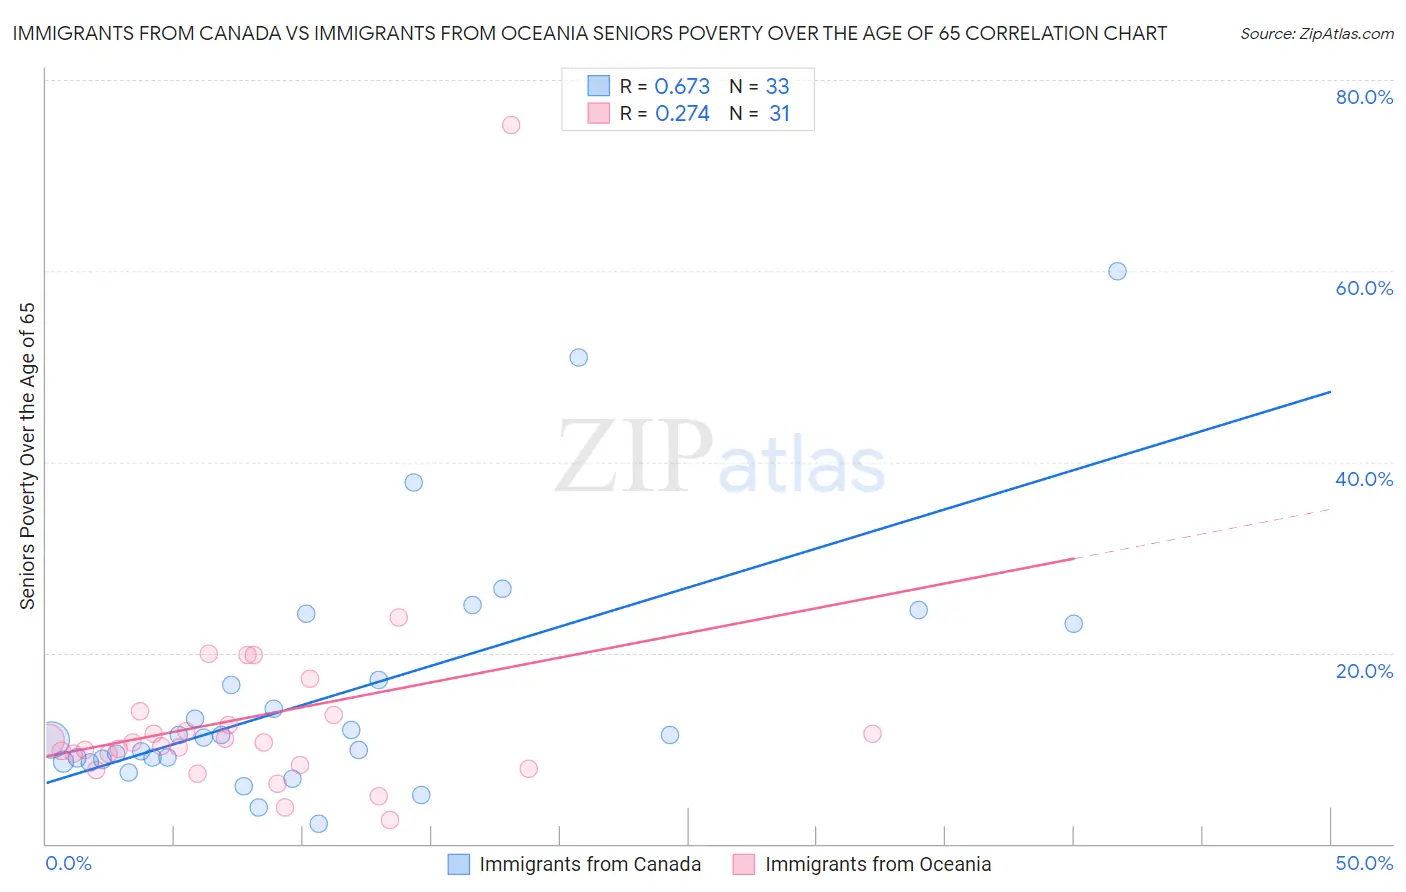
Immigrants from Canada vs Immigrants from Oceania Seniors Poverty Over the Age of 65 Correlation Chart
The statistical analysis conducted on geographies consisting of 457,331,043 people shows a significant positive correlation between the proportion of Immigrants from Canada and poverty level among seniors over the age of 65 in the United States with a correlation coefficient (R) of 0.673 and weighted average of 9.8%. Similarly, the statistical analysis conducted on geographies consisting of 304,434,853 people shows a weak positive correlation between the proportion of Immigrants from Oceania and poverty level among seniors over the age of 65 in the United States with a correlation coefficient (R) of 0.274 and weighted average of 10.4%, a difference of 6.3%.
Seniors Poverty Over the Age of 65 Correlation Summary
| Measurement | Immigrants from Canada | Immigrants from Oceania |
| Minimum | 2.1% | 2.5% |
| Maximum | 60.0% | 75.3% |
| Range | 57.9% | 72.8% |
| Mean | 15.6% | 13.3% |
| Median | 11.1% | 10.6% |
| Interquartile 25% (IQ1) | 8.7% | 8.3% |
| Interquartile 75% (IQ3) | 20.1% | 13.5% |
| Interquartile Range (IQR) | 11.4% | 5.2% |
| Standard Deviation (Sample) | 12.9% | 12.5% |
| Standard Deviation (Population) | 12.7% | 12.3% |
Similar Demographics by Seniors Poverty Over the Age of 65
Demographics Similar to Immigrants from Canada by Seniors Poverty Over the Age of 65
In terms of seniors poverty over the age of 65, the demographic groups most similar to Immigrants from Canada are Celtic (9.8%, a difference of 0.030%), Iranian (9.8%, a difference of 0.11%), Serbian (9.8%, a difference of 0.15%), French Canadian (9.8%, a difference of 0.16%), and Bolivian (9.8%, a difference of 0.21%).
| Demographics | Rating | Rank | Seniors Poverty Over the Age of 65 |
| Filipinos | 99.3 /100 | #52 | Exceptional 9.7% |
| Slavs | 99.2 /100 | #53 | Exceptional 9.8% |
| Immigrants | Northern Europe | 99.2 /100 | #54 | Exceptional 9.8% |
| Afghans | 99.2 /100 | #55 | Exceptional 9.8% |
| Immigrants | England | 99.1 /100 | #56 | Exceptional 9.8% |
| Bolivians | 99.1 /100 | #57 | Exceptional 9.8% |
| Serbians | 99.1 /100 | #58 | Exceptional 9.8% |
| Immigrants | Canada | 99.0 /100 | #59 | Exceptional 9.8% |
| Celtics | 99.0 /100 | #60 | Exceptional 9.8% |
| Iranians | 98.9 /100 | #61 | Exceptional 9.8% |
| French Canadians | 98.9 /100 | #62 | Exceptional 9.8% |
| Macedonians | 98.8 /100 | #63 | Exceptional 9.9% |
| Immigrants | North America | 98.8 /100 | #64 | Exceptional 9.9% |
| Pennsylvania Germans | 98.7 /100 | #65 | Exceptional 9.9% |
| Immigrants | Netherlands | 98.7 /100 | #66 | Exceptional 9.9% |
Demographics Similar to Immigrants from Oceania by Seniors Poverty Over the Age of 65
In terms of seniors poverty over the age of 65, the demographic groups most similar to Immigrants from Oceania are Immigrants from Iran (10.4%, a difference of 0.0%), Ottawa (10.4%, a difference of 0.020%), Cambodian (10.4%, a difference of 0.15%), Egyptian (10.5%, a difference of 0.15%), and Immigrants from Hungary (10.4%, a difference of 0.16%).
| Demographics | Rating | Rank | Seniors Poverty Over the Age of 65 |
| Hmong | 90.0 /100 | #123 | Exceptional 10.4% |
| Asians | 89.9 /100 | #124 | Excellent 10.4% |
| Immigrants | Philippines | 89.4 /100 | #125 | Excellent 10.4% |
| Immigrants | Hungary | 89.1 /100 | #126 | Excellent 10.4% |
| Cambodians | 89.1 /100 | #127 | Excellent 10.4% |
| Ottawa | 88.5 /100 | #128 | Excellent 10.4% |
| Immigrants | Iran | 88.4 /100 | #129 | Excellent 10.4% |
| Immigrants | Oceania | 88.4 /100 | #130 | Excellent 10.4% |
| Egyptians | 87.8 /100 | #131 | Excellent 10.5% |
| Immigrants | Turkey | 87.7 /100 | #132 | Excellent 10.5% |
| Guamanians/Chamorros | 87.5 /100 | #133 | Excellent 10.5% |
| Sierra Leoneans | 86.8 /100 | #134 | Excellent 10.5% |
| Immigrants | Norway | 86.5 /100 | #135 | Excellent 10.5% |
| Immigrants | Serbia | 86.4 /100 | #136 | Excellent 10.5% |
| Immigrants | Australia | 85.1 /100 | #137 | Excellent 10.5% |