Immigrants from Romania vs Hawaiian Single Father Poverty
COMPARE
Immigrants from Romania
Hawaiian
Single Father Poverty
Single Father Poverty Comparison
Immigrants from Romania
Hawaiians
15.5%
SINGLE FATHER POVERTY
98.6/ 100
METRIC RATING
91st/ 347
METRIC RANK
15.1%
SINGLE FATHER POVERTY
99.9/ 100
METRIC RATING
58th/ 347
METRIC RANK
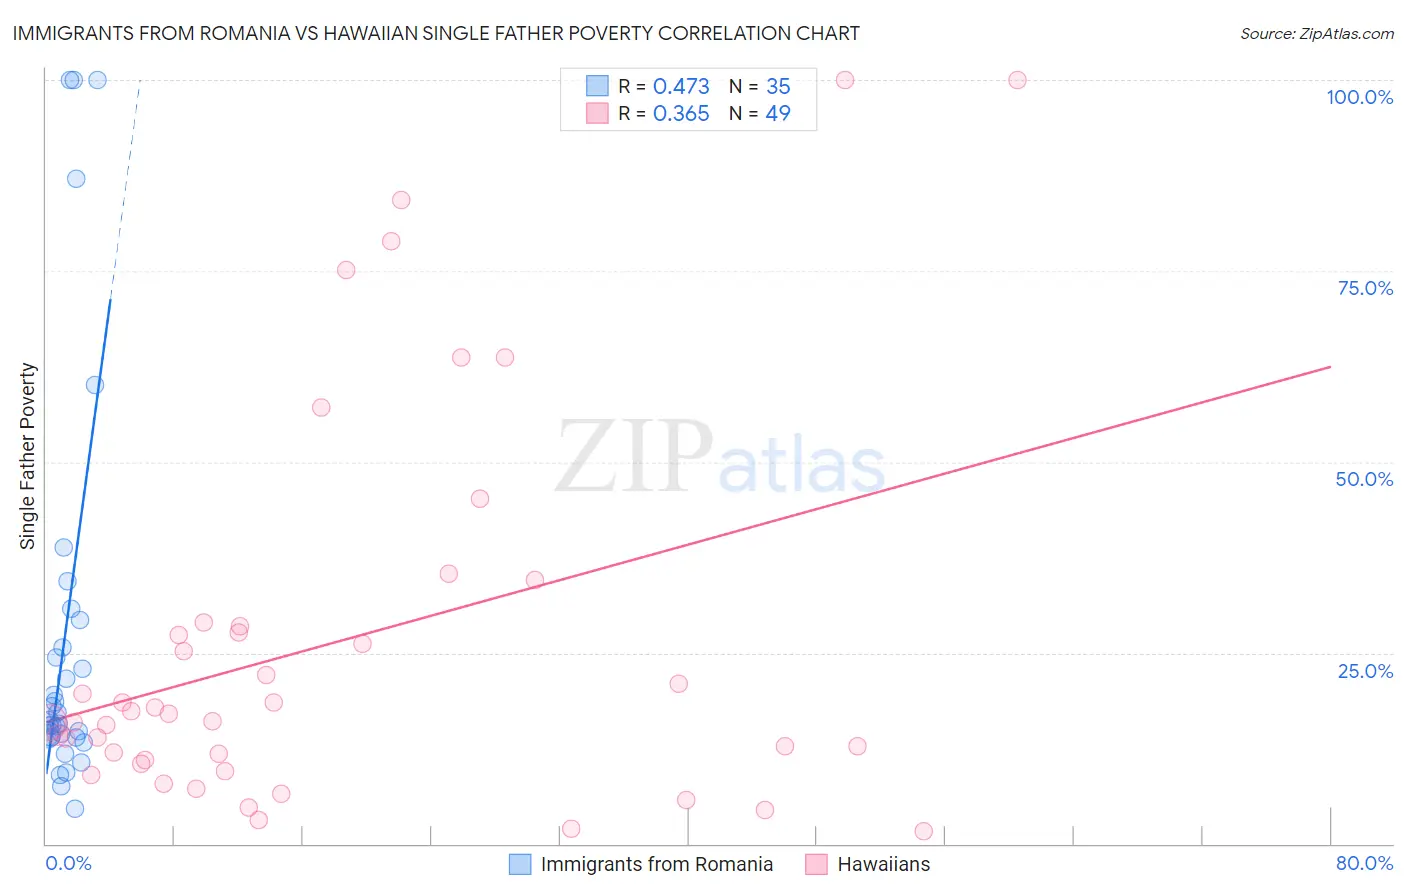
Immigrants from Romania vs Hawaiian Single Father Poverty Correlation Chart
The statistical analysis conducted on geographies consisting of 209,903,487 people shows a moderate positive correlation between the proportion of Immigrants from Romania and poverty level among single fathers in the United States with a correlation coefficient (R) of 0.473 and weighted average of 15.5%. Similarly, the statistical analysis conducted on geographies consisting of 272,607,469 people shows a mild positive correlation between the proportion of Hawaiians and poverty level among single fathers in the United States with a correlation coefficient (R) of 0.365 and weighted average of 15.1%, a difference of 3.0%.
Single Father Poverty Correlation Summary
| Measurement | Immigrants from Romania | Hawaiian |
| Minimum | 4.5% | 1.7% |
| Maximum | 100.0% | 100.0% |
| Range | 95.5% | 98.3% |
| Mean | 27.9% | 26.3% |
| Median | 16.0% | 17.0% |
| Interquartile 25% (IQ1) | 13.9% | 10.7% |
| Interquartile 75% (IQ3) | 29.3% | 28.7% |
| Interquartile Range (IQR) | 15.3% | 18.0% |
| Standard Deviation (Sample) | 27.1% | 25.4% |
| Standard Deviation (Population) | 26.8% | 25.2% |
Similar Demographics by Single Father Poverty
Demographics Similar to Immigrants from Romania by Single Father Poverty
In terms of single father poverty, the demographic groups most similar to Immigrants from Romania are Mexican American Indian (15.5%, a difference of 0.10%), Immigrants from Serbia (15.5%, a difference of 0.11%), Basque (15.5%, a difference of 0.15%), Immigrants from Uruguay (15.6%, a difference of 0.29%), and Immigrants from Korea (15.5%, a difference of 0.34%).
| Demographics | Rating | Rank | Single Father Poverty |
| Peruvians | 99.2 /100 | #84 | Exceptional 15.4% |
| Immigrants | Oceania | 99.1 /100 | #85 | Exceptional 15.4% |
| Immigrants | Russia | 99.0 /100 | #86 | Exceptional 15.5% |
| Brazilians | 99.0 /100 | #87 | Exceptional 15.5% |
| Burmese | 99.0 /100 | #88 | Exceptional 15.5% |
| Immigrants | Korea | 99.0 /100 | #89 | Exceptional 15.5% |
| Mexican American Indians | 98.7 /100 | #90 | Exceptional 15.5% |
| Immigrants | Romania | 98.6 /100 | #91 | Exceptional 15.5% |
| Immigrants | Serbia | 98.5 /100 | #92 | Exceptional 15.5% |
| Basques | 98.4 /100 | #93 | Exceptional 15.5% |
| Immigrants | Uruguay | 98.2 /100 | #94 | Exceptional 15.6% |
| Immigrants | Kazakhstan | 98.2 /100 | #95 | Exceptional 15.6% |
| Immigrants | Belgium | 98.1 /100 | #96 | Exceptional 15.6% |
| Yaqui | 98.1 /100 | #97 | Exceptional 15.6% |
| Zimbabweans | 98.1 /100 | #98 | Exceptional 15.6% |
Demographics Similar to Hawaiians by Single Father Poverty
In terms of single father poverty, the demographic groups most similar to Hawaiians are Laotian (15.1%, a difference of 0.060%), Guamanian/Chamorro (15.1%, a difference of 0.10%), Immigrants from Laos (15.1%, a difference of 0.14%), Immigrants from Bulgaria (15.0%, a difference of 0.42%), and Immigrants from Uzbekistan (15.0%, a difference of 0.47%).
| Demographics | Rating | Rank | Single Father Poverty |
| Immigrants | Pakistan | 99.9 /100 | #51 | Exceptional 15.0% |
| Immigrants | El Salvador | 99.9 /100 | #52 | Exceptional 15.0% |
| Immigrants | Kenya | 99.9 /100 | #53 | Exceptional 15.0% |
| Immigrants | Uzbekistan | 99.9 /100 | #54 | Exceptional 15.0% |
| Immigrants | Bulgaria | 99.9 /100 | #55 | Exceptional 15.0% |
| Immigrants | Laos | 99.9 /100 | #56 | Exceptional 15.1% |
| Laotians | 99.9 /100 | #57 | Exceptional 15.1% |
| Hawaiians | 99.9 /100 | #58 | Exceptional 15.1% |
| Guamanians/Chamorros | 99.9 /100 | #59 | Exceptional 15.1% |
| Puget Sound Salish | 99.8 /100 | #60 | Exceptional 15.2% |
| Immigrants | Bosnia and Herzegovina | 99.8 /100 | #61 | Exceptional 15.2% |
| Immigrants | Armenia | 99.8 /100 | #62 | Exceptional 15.2% |
| Immigrants | Sweden | 99.8 /100 | #63 | Exceptional 15.2% |
| Bangladeshis | 99.8 /100 | #64 | Exceptional 15.2% |
| Immigrants | Malaysia | 99.8 /100 | #65 | Exceptional 15.2% |