Immigrants from Poland vs Palestinian Female Poverty Among 18-24 Year Olds
COMPARE
Immigrants from Poland
Palestinian
Female Poverty Among 18-24 Year Olds
Female Poverty Among 18-24 Year Olds Comparison
Immigrants from Poland
Palestinians
17.1%
FEMALE POVERTY AMONG 18-24 YEAR OLDS
100.0/ 100
METRIC RATING
13th/ 347
METRIC RANK
18.8%
FEMALE POVERTY AMONG 18-24 YEAR OLDS
99.5/ 100
METRIC RATING
80th/ 347
METRIC RANK
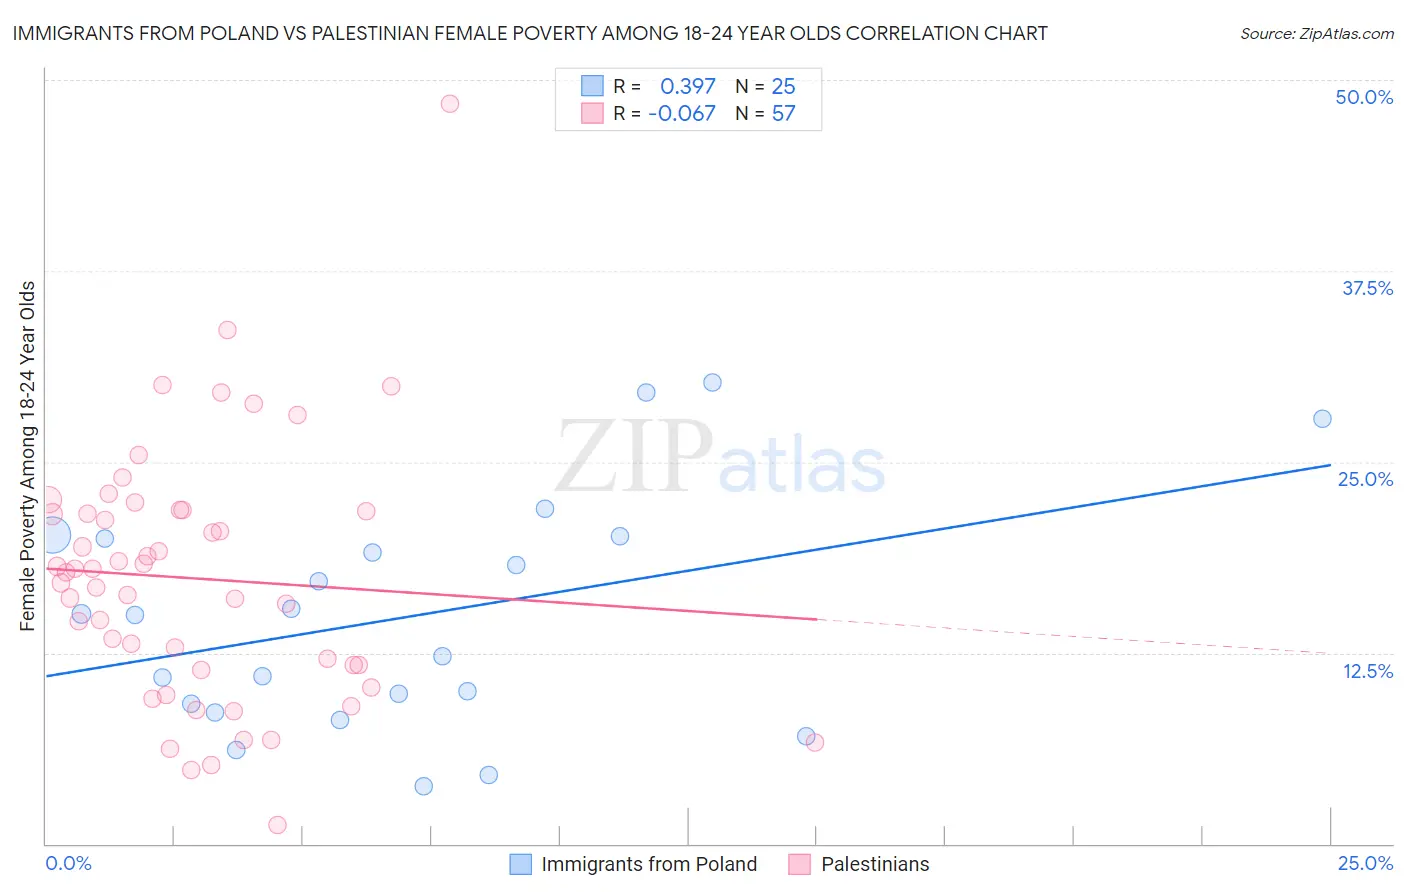
Immigrants from Poland vs Palestinian Female Poverty Among 18-24 Year Olds Correlation Chart
The statistical analysis conducted on geographies consisting of 296,317,413 people shows a mild positive correlation between the proportion of Immigrants from Poland and poverty level among females between the ages 18 and 24 in the United States with a correlation coefficient (R) of 0.397 and weighted average of 17.1%. Similarly, the statistical analysis conducted on geographies consisting of 214,096,345 people shows a slight negative correlation between the proportion of Palestinians and poverty level among females between the ages 18 and 24 in the United States with a correlation coefficient (R) of -0.067 and weighted average of 18.8%, a difference of 10.0%.
Female Poverty Among 18-24 Year Olds Correlation Summary
| Measurement | Immigrants from Poland | Palestinian |
| Minimum | 3.8% | 1.2% |
| Maximum | 30.2% | 48.5% |
| Range | 26.5% | 47.3% |
| Mean | 14.8% | 17.4% |
| Median | 15.0% | 17.8% |
| Interquartile 25% (IQ1) | 8.9% | 11.5% |
| Interquartile 75% (IQ3) | 20.1% | 21.8% |
| Interquartile Range (IQR) | 11.2% | 10.3% |
| Standard Deviation (Sample) | 7.5% | 8.3% |
| Standard Deviation (Population) | 7.4% | 8.3% |
Similar Demographics by Female Poverty Among 18-24 Year Olds
Demographics Similar to Immigrants from Poland by Female Poverty Among 18-24 Year Olds
In terms of female poverty among 18-24 year olds, the demographic groups most similar to Immigrants from Poland are Tongan (17.1%, a difference of 0.17%), Cuban (17.2%, a difference of 0.45%), Immigrants from Pakistan (17.0%, a difference of 0.66%), Peruvian (17.2%, a difference of 0.68%), and Thai (17.0%, a difference of 0.75%).
| Demographics | Rating | Rank | Female Poverty Among 18-24 Year Olds |
| Immigrants | Philippines | 100.0 /100 | #6 | Exceptional 16.7% |
| Immigrants | Azores | 100.0 /100 | #7 | Exceptional 16.7% |
| Immigrants | Bolivia | 100.0 /100 | #8 | Exceptional 16.7% |
| Immigrants | Peru | 100.0 /100 | #9 | Exceptional 16.9% |
| Koreans | 100.0 /100 | #10 | Exceptional 16.9% |
| Thais | 100.0 /100 | #11 | Exceptional 17.0% |
| Immigrants | Pakistan | 100.0 /100 | #12 | Exceptional 17.0% |
| Immigrants | Poland | 100.0 /100 | #13 | Exceptional 17.1% |
| Tongans | 100.0 /100 | #14 | Exceptional 17.1% |
| Cubans | 100.0 /100 | #15 | Exceptional 17.2% |
| Peruvians | 100.0 /100 | #16 | Exceptional 17.2% |
| Immigrants | Taiwan | 100.0 /100 | #17 | Exceptional 17.3% |
| Immigrants | Colombia | 100.0 /100 | #18 | Exceptional 17.3% |
| Immigrants | Lithuania | 100.0 /100 | #19 | Exceptional 17.4% |
| Immigrants | Venezuela | 100.0 /100 | #20 | Exceptional 17.4% |
Demographics Similar to Palestinians by Female Poverty Among 18-24 Year Olds
In terms of female poverty among 18-24 year olds, the demographic groups most similar to Palestinians are Japanese (18.8%, a difference of 0.0%), Immigrants from Europe (18.8%, a difference of 0.080%), Uruguayan (18.8%, a difference of 0.080%), Costa Rican (18.8%, a difference of 0.090%), and Immigrants from Uruguay (18.8%, a difference of 0.11%).
| Demographics | Rating | Rank | Female Poverty Among 18-24 Year Olds |
| Lithuanians | 99.7 /100 | #73 | Exceptional 18.7% |
| Hawaiians | 99.6 /100 | #74 | Exceptional 18.7% |
| Poles | 99.6 /100 | #75 | Exceptional 18.8% |
| Immigrants | Cambodia | 99.5 /100 | #76 | Exceptional 18.8% |
| Costa Ricans | 99.5 /100 | #77 | Exceptional 18.8% |
| Immigrants | Europe | 99.5 /100 | #78 | Exceptional 18.8% |
| Uruguayans | 99.5 /100 | #79 | Exceptional 18.8% |
| Palestinians | 99.5 /100 | #80 | Exceptional 18.8% |
| Japanese | 99.5 /100 | #81 | Exceptional 18.8% |
| Immigrants | Uruguay | 99.4 /100 | #82 | Exceptional 18.8% |
| Immigrants | Indonesia | 99.4 /100 | #83 | Exceptional 18.9% |
| Burmese | 99.2 /100 | #84 | Exceptional 18.9% |
| Immigrants | Armenia | 99.2 /100 | #85 | Exceptional 18.9% |
| Immigrants | Iraq | 99.2 /100 | #86 | Exceptional 18.9% |
| Immigrants | Jamaica | 99.2 /100 | #87 | Exceptional 18.9% |