Austrian vs Belgian Single Male Poverty
COMPARE
Austrian
Belgian
Single Male Poverty
Single Male Poverty Comparison
Austrians
Belgians
13.1%
SINGLE MALE POVERTY
13.9/ 100
METRIC RATING
216th/ 347
METRIC RANK
13.5%
SINGLE MALE POVERTY
1.2/ 100
METRIC RATING
247th/ 347
METRIC RANK
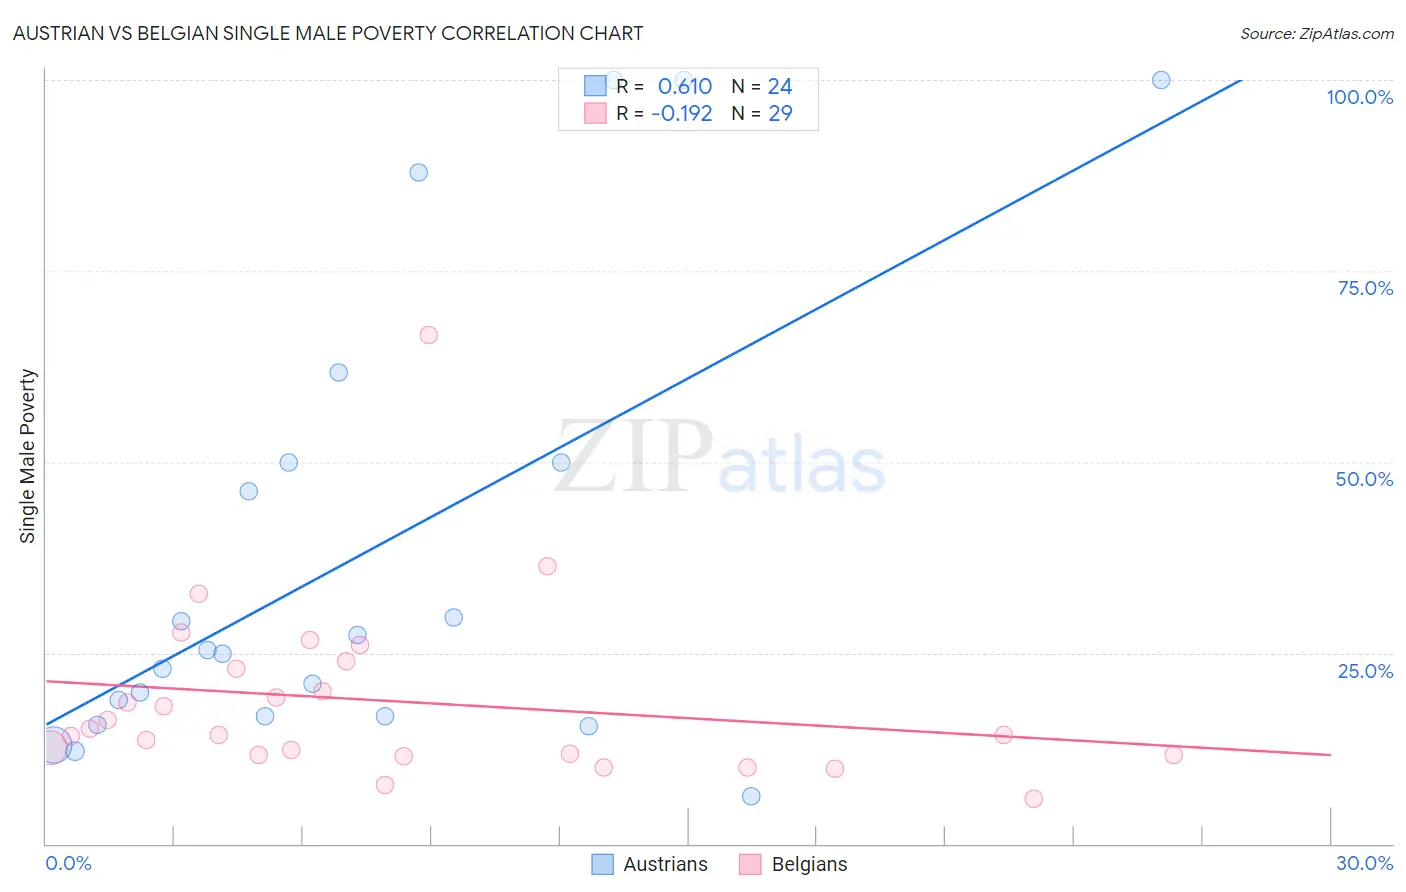
Austrian vs Belgian Single Male Poverty Correlation Chart
The statistical analysis conducted on geographies consisting of 387,730,655 people shows a significant positive correlation between the proportion of Austrians and poverty level among single males in the United States with a correlation coefficient (R) of 0.610 and weighted average of 13.1%. Similarly, the statistical analysis conducted on geographies consisting of 312,309,142 people shows a poor negative correlation between the proportion of Belgians and poverty level among single males in the United States with a correlation coefficient (R) of -0.192 and weighted average of 13.5%, a difference of 3.3%.
Single Male Poverty Correlation Summary
| Measurement | Austrian | Belgian |
| Minimum | 6.2% | 5.9% |
| Maximum | 100.0% | 66.7% |
| Range | 93.8% | 60.8% |
| Mean | 37.9% | 18.6% |
| Median | 25.1% | 14.3% |
| Interquartile 25% (IQ1) | 16.7% | 11.6% |
| Interquartile 75% (IQ3) | 50.0% | 23.4% |
| Interquartile Range (IQR) | 33.3% | 11.7% |
| Standard Deviation (Sample) | 30.2% | 11.9% |
| Standard Deviation (Population) | 29.6% | 11.7% |
Similar Demographics by Single Male Poverty
Demographics Similar to Austrians by Single Male Poverty
In terms of single male poverty, the demographic groups most similar to Austrians are Japanese (13.1%, a difference of 0.090%), Zimbabwean (13.1%, a difference of 0.10%), Bermudan (13.1%, a difference of 0.10%), Scandinavian (13.1%, a difference of 0.11%), and Immigrants from Burma/Myanmar (13.1%, a difference of 0.15%).
| Demographics | Rating | Rank | Single Male Poverty |
| Mexican American Indians | 17.5 /100 | #209 | Poor 13.1% |
| Immigrants | Haiti | 16.8 /100 | #210 | Poor 13.1% |
| Swedes | 16.8 /100 | #211 | Poor 13.1% |
| Senegalese | 16.4 /100 | #212 | Poor 13.1% |
| Italians | 15.9 /100 | #213 | Poor 13.1% |
| Zimbabweans | 14.9 /100 | #214 | Poor 13.1% |
| Japanese | 14.8 /100 | #215 | Poor 13.1% |
| Austrians | 13.9 /100 | #216 | Poor 13.1% |
| Bermudans | 13.0 /100 | #217 | Poor 13.1% |
| Scandinavians | 12.9 /100 | #218 | Poor 13.1% |
| Immigrants | Burma/Myanmar | 12.6 /100 | #219 | Poor 13.1% |
| Central Americans | 10.9 /100 | #220 | Poor 13.2% |
| New Zealanders | 10.7 /100 | #221 | Poor 13.2% |
| Immigrants | Western Europe | 10.0 /100 | #222 | Poor 13.2% |
| Immigrants | Azores | 9.3 /100 | #223 | Tragic 13.2% |
Demographics Similar to Belgians by Single Male Poverty
In terms of single male poverty, the demographic groups most similar to Belgians are Immigrants from Micronesia (13.5%, a difference of 0.010%), Czech (13.5%, a difference of 0.030%), Immigrants from Latin America (13.5%, a difference of 0.12%), Spanish (13.6%, a difference of 0.27%), and Immigrants from Somalia (13.6%, a difference of 0.29%).
| Demographics | Rating | Rank | Single Male Poverty |
| Belizeans | 2.3 /100 | #240 | Tragic 13.4% |
| Immigrants | Germany | 2.1 /100 | #241 | Tragic 13.4% |
| Carpatho Rusyns | 2.1 /100 | #242 | Tragic 13.4% |
| Barbadians | 2.1 /100 | #243 | Tragic 13.4% |
| Immigrants | Senegal | 1.7 /100 | #244 | Tragic 13.5% |
| Immigrants | Latin America | 1.3 /100 | #245 | Tragic 13.5% |
| Immigrants | Micronesia | 1.2 /100 | #246 | Tragic 13.5% |
| Belgians | 1.2 /100 | #247 | Tragic 13.5% |
| Czechs | 1.2 /100 | #248 | Tragic 13.5% |
| Spanish | 1.0 /100 | #249 | Tragic 13.6% |
| Immigrants | Somalia | 1.0 /100 | #250 | Tragic 13.6% |
| Immigrants | Zaire | 0.9 /100 | #251 | Tragic 13.6% |
| Finns | 0.9 /100 | #252 | Tragic 13.6% |
| German Russians | 0.8 /100 | #253 | Tragic 13.6% |
| Sub-Saharan Africans | 0.5 /100 | #254 | Tragic 13.7% |