Immigrants from Poland vs Belgian Family Households
COMPARE
Immigrants from Poland
Belgian
Family Households
Family Households Comparison
Immigrants from Poland
Belgians
65.2%
FAMILY HOUSEHOLDS
98.7/ 100
METRIC RATING
94th/ 347
METRIC RANK
63.8%
FAMILY HOUSEHOLDS
7.6/ 100
METRIC RATING
215th/ 347
METRIC RANK
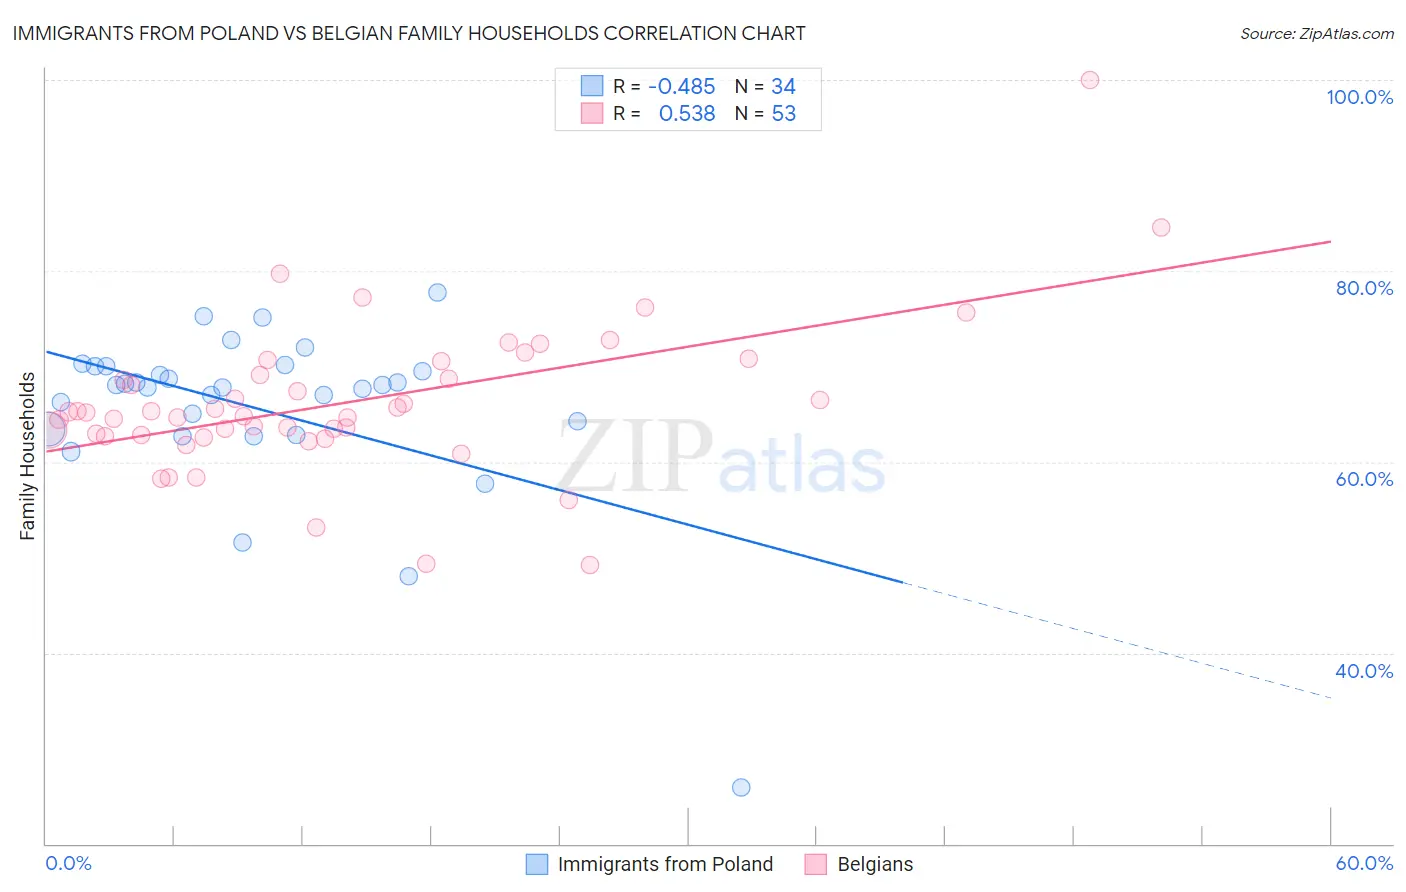
Immigrants from Poland vs Belgian Family Households Correlation Chart
The statistical analysis conducted on geographies consisting of 304,786,496 people shows a moderate negative correlation between the proportion of Immigrants from Poland and percentage of family households in the United States with a correlation coefficient (R) of -0.485 and weighted average of 65.2%. Similarly, the statistical analysis conducted on geographies consisting of 355,849,592 people shows a substantial positive correlation between the proportion of Belgians and percentage of family households in the United States with a correlation coefficient (R) of 0.538 and weighted average of 63.8%, a difference of 2.3%.
Family Households Correlation Summary
| Measurement | Immigrants from Poland | Belgian |
| Minimum | 25.9% | 49.1% |
| Maximum | 77.7% | 100.0% |
| Range | 51.8% | 50.9% |
| Mean | 65.6% | 66.3% |
| Median | 67.9% | 65.2% |
| Interquartile 25% (IQ1) | 63.4% | 62.7% |
| Interquartile 75% (IQ3) | 70.0% | 69.8% |
| Interquartile Range (IQR) | 6.6% | 7.1% |
| Standard Deviation (Sample) | 9.2% | 8.1% |
| Standard Deviation (Population) | 9.0% | 8.1% |
Similar Demographics by Family Households
Demographics Similar to Immigrants from Poland by Family Households
In terms of family households, the demographic groups most similar to Immigrants from Poland are Hopi (65.3%, a difference of 0.020%), Guyanese (65.3%, a difference of 0.020%), Immigrants from Portugal (65.2%, a difference of 0.030%), Swiss (65.2%, a difference of 0.030%), and Guatemalan (65.2%, a difference of 0.030%).
| Demographics | Rating | Rank | Family Households |
| Immigrants | Egypt | 99.2 /100 | #87 | Exceptional 65.3% |
| Immigrants | Haiti | 99.1 /100 | #88 | Exceptional 65.3% |
| Immigrants | Caribbean | 99.1 /100 | #89 | Exceptional 65.3% |
| Immigrants | Laos | 99.1 /100 | #90 | Exceptional 65.3% |
| Crow | 98.9 /100 | #91 | Exceptional 65.3% |
| Hopi | 98.8 /100 | #92 | Exceptional 65.3% |
| Guyanese | 98.8 /100 | #93 | Exceptional 65.3% |
| Immigrants | Poland | 98.7 /100 | #94 | Exceptional 65.2% |
| Immigrants | Portugal | 98.6 /100 | #95 | Exceptional 65.2% |
| Swiss | 98.6 /100 | #96 | Exceptional 65.2% |
| Guatemalans | 98.6 /100 | #97 | Exceptional 65.2% |
| Immigrants | Syria | 98.4 /100 | #98 | Exceptional 65.2% |
| Central American Indians | 98.3 /100 | #99 | Exceptional 65.2% |
| Haitians | 98.1 /100 | #100 | Exceptional 65.2% |
| Chileans | 98.1 /100 | #101 | Exceptional 65.2% |
Demographics Similar to Belgians by Family Households
In terms of family households, the demographic groups most similar to Belgians are Celtic (63.8%, a difference of 0.020%), Croatian (63.8%, a difference of 0.020%), Osage (63.7%, a difference of 0.030%), Marshallese (63.7%, a difference of 0.030%), and Immigrants from Northern Europe (63.8%, a difference of 0.060%).
| Demographics | Rating | Rank | Family Households |
| Immigrants | Bangladesh | 11.4 /100 | #208 | Poor 63.9% |
| Sierra Leoneans | 11.2 /100 | #209 | Poor 63.9% |
| Immigrants | Thailand | 9.6 /100 | #210 | Tragic 63.8% |
| Shoshone | 9.4 /100 | #211 | Tragic 63.8% |
| Immigrants | Netherlands | 9.4 /100 | #212 | Tragic 63.8% |
| Immigrants | Northern Europe | 8.8 /100 | #213 | Tragic 63.8% |
| Celtics | 8.0 /100 | #214 | Tragic 63.8% |
| Belgians | 7.6 /100 | #215 | Tragic 63.8% |
| Croatians | 7.3 /100 | #216 | Tragic 63.8% |
| Osage | 7.0 /100 | #217 | Tragic 63.7% |
| Marshallese | 6.9 /100 | #218 | Tragic 63.7% |
| Macedonians | 6.5 /100 | #219 | Tragic 63.7% |
| Immigrants | Europe | 6.4 /100 | #220 | Tragic 63.7% |
| Immigrants | South Africa | 5.9 /100 | #221 | Tragic 63.7% |
| Immigrants | Belarus | 5.5 /100 | #222 | Tragic 63.7% |