Sri Lankan vs Immigrants from France Poverty
COMPARE
Sri Lankan
Immigrants from France
Poverty
Poverty Comparison
Sri Lankans
Immigrants from France
11.7%
POVERTY
89.4/ 100
METRIC RATING
117th/ 347
METRIC RANK
11.9%
POVERTY
80.5/ 100
METRIC RATING
141st/ 347
METRIC RANK
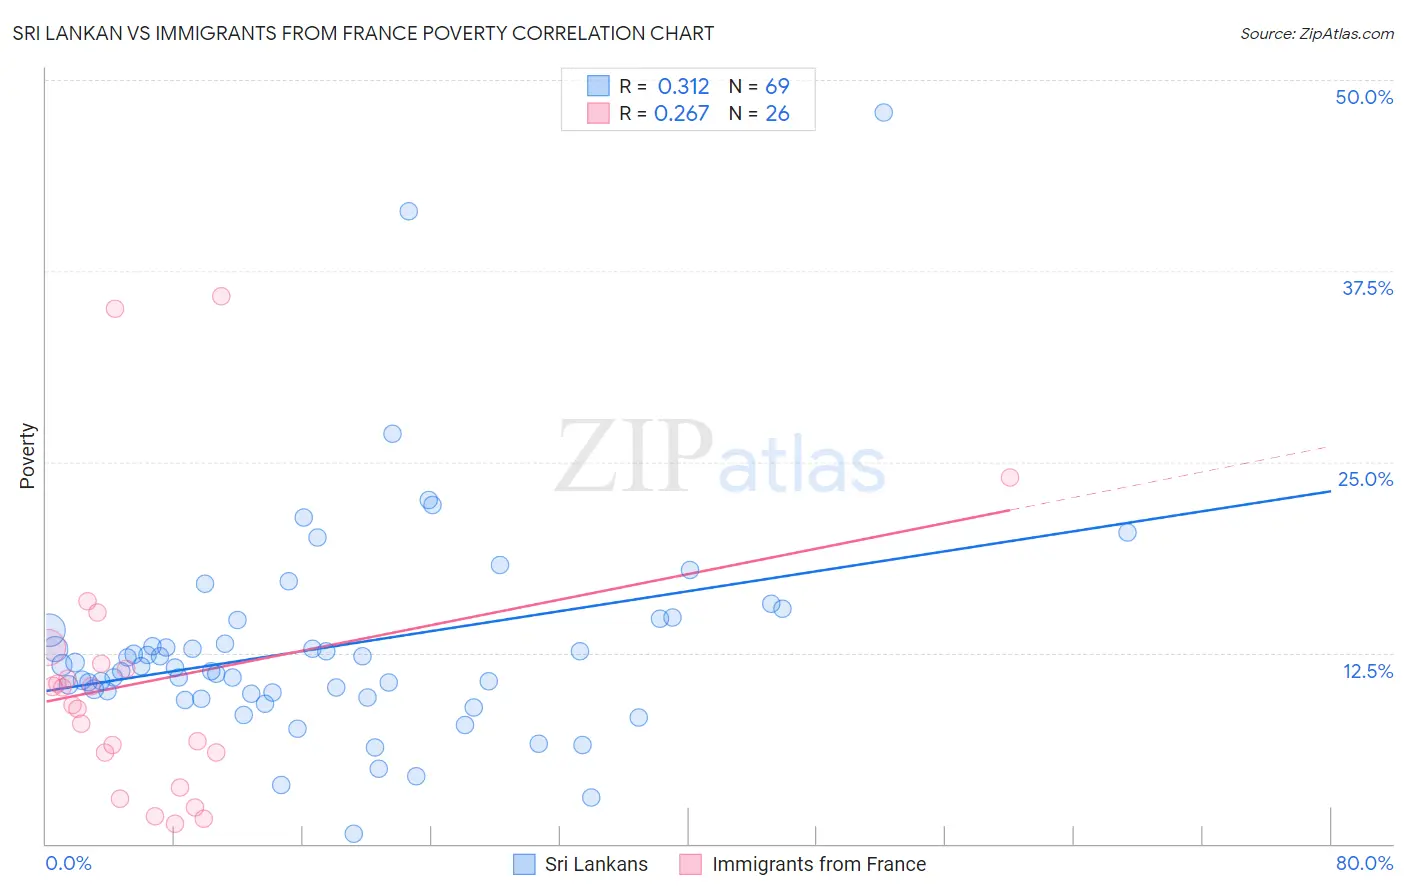
Sri Lankan vs Immigrants from France Poverty Correlation Chart
The statistical analysis conducted on geographies consisting of 440,138,450 people shows a mild positive correlation between the proportion of Sri Lankans and poverty level in the United States with a correlation coefficient (R) of 0.312 and weighted average of 11.7%. Similarly, the statistical analysis conducted on geographies consisting of 287,842,185 people shows a weak positive correlation between the proportion of Immigrants from France and poverty level in the United States with a correlation coefficient (R) of 0.267 and weighted average of 11.9%, a difference of 1.8%.
Poverty Correlation Summary
| Measurement | Sri Lankan | Immigrants from France |
| Minimum | 0.64% | 1.3% |
| Maximum | 47.9% | 35.9% |
| Range | 47.2% | 34.6% |
| Mean | 12.9% | 10.7% |
| Median | 11.5% | 9.7% |
| Interquartile 25% (IQ1) | 9.7% | 6.0% |
| Interquartile 75% (IQ3) | 14.3% | 11.8% |
| Interquartile Range (IQR) | 4.6% | 5.8% |
| Standard Deviation (Sample) | 7.2% | 8.9% |
| Standard Deviation (Population) | 7.2% | 8.7% |
Similar Demographics by Poverty
Demographics Similar to Sri Lankans by Poverty
In terms of poverty, the demographic groups most similar to Sri Lankans are Immigrants from Russia (11.7%, a difference of 0.070%), Argentinean (11.7%, a difference of 0.080%), Tlingit-Haida (11.7%, a difference of 0.12%), Immigrants from South Eastern Asia (11.7%, a difference of 0.13%), and New Zealander (11.7%, a difference of 0.19%).
| Demographics | Rating | Rank | Poverty |
| Welsh | 91.6 /100 | #110 | Exceptional 11.6% |
| French Canadians | 91.0 /100 | #111 | Exceptional 11.6% |
| Immigrants | Southern Europe | 90.8 /100 | #112 | Exceptional 11.6% |
| Immigrants | Belarus | 90.8 /100 | #113 | Exceptional 11.6% |
| Immigrants | China | 90.7 /100 | #114 | Exceptional 11.6% |
| Albanians | 90.3 /100 | #115 | Exceptional 11.7% |
| Immigrants | Russia | 89.7 /100 | #116 | Excellent 11.7% |
| Sri Lankans | 89.4 /100 | #117 | Excellent 11.7% |
| Argentineans | 89.1 /100 | #118 | Excellent 11.7% |
| Tlingit-Haida | 89.0 /100 | #119 | Excellent 11.7% |
| Immigrants | South Eastern Asia | 88.9 /100 | #120 | Excellent 11.7% |
| New Zealanders | 88.7 /100 | #121 | Excellent 11.7% |
| Puget Sound Salish | 88.7 /100 | #122 | Excellent 11.7% |
| Immigrants | Hungary | 88.6 /100 | #123 | Excellent 11.7% |
| Soviet Union | 88.4 /100 | #124 | Excellent 11.7% |
Demographics Similar to Immigrants from France by Poverty
In terms of poverty, the demographic groups most similar to Immigrants from France are Basque (11.9%, a difference of 0.020%), Immigrants from Peru (11.9%, a difference of 0.090%), Brazilian (11.9%, a difference of 0.12%), Pakistani (11.9%, a difference of 0.28%), and Immigrants from Jordan (11.9%, a difference of 0.31%).
| Demographics | Rating | Rank | Poverty |
| Yugoslavians | 85.2 /100 | #134 | Excellent 11.8% |
| Immigrants | Vietnam | 85.2 /100 | #135 | Excellent 11.8% |
| Chileans | 84.2 /100 | #136 | Excellent 11.8% |
| Immigrants | Switzerland | 83.0 /100 | #137 | Excellent 11.8% |
| Immigrants | Jordan | 82.4 /100 | #138 | Excellent 11.9% |
| Pakistanis | 82.2 /100 | #139 | Excellent 11.9% |
| Immigrants | Peru | 81.1 /100 | #140 | Excellent 11.9% |
| Immigrants | France | 80.5 /100 | #141 | Excellent 11.9% |
| Basques | 80.4 /100 | #142 | Excellent 11.9% |
| Brazilians | 79.7 /100 | #143 | Good 11.9% |
| Icelanders | 77.9 /100 | #144 | Good 11.9% |
| Syrians | 75.1 /100 | #145 | Good 12.0% |
| Afghans | 74.9 /100 | #146 | Good 12.0% |
| Immigrants | Bosnia and Herzegovina | 73.7 /100 | #147 | Good 12.0% |
| Immigrants | Germany | 72.7 /100 | #148 | Good 12.0% |