Immigrants from Oceania vs Arab Child Poverty Among Boys Under 16
COMPARE
Immigrants from Oceania
Arab
Child Poverty Among Boys Under 16
Child Poverty Among Boys Under 16 Comparison
Immigrants from Oceania
Arabs
16.0%
CHILD POVERTY AMONG BOYS UNDER 16
71.3/ 100
METRIC RATING
161st/ 347
METRIC RANK
16.8%
CHILD POVERTY AMONG BOYS UNDER 16
31.1/ 100
METRIC RATING
190th/ 347
METRIC RANK
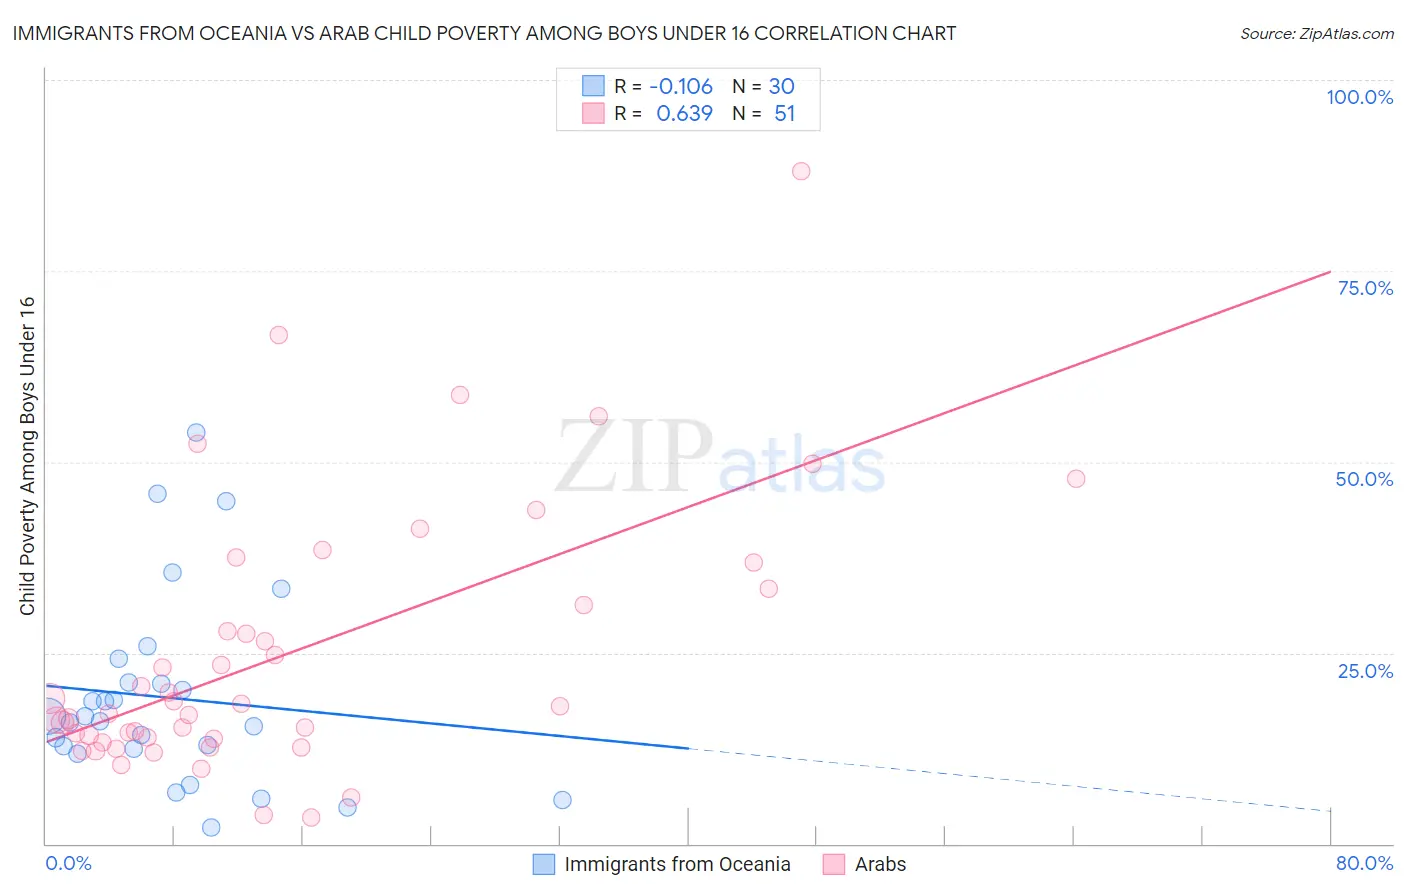
Immigrants from Oceania vs Arab Child Poverty Among Boys Under 16 Correlation Chart
The statistical analysis conducted on geographies consisting of 301,361,436 people shows a poor negative correlation between the proportion of Immigrants from Oceania and poverty level among boys under the age of 16 in the United States with a correlation coefficient (R) of -0.106 and weighted average of 16.0%. Similarly, the statistical analysis conducted on geographies consisting of 475,195,630 people shows a significant positive correlation between the proportion of Arabs and poverty level among boys under the age of 16 in the United States with a correlation coefficient (R) of 0.639 and weighted average of 16.8%, a difference of 4.9%.
Child Poverty Among Boys Under 16 Correlation Summary
| Measurement | Immigrants from Oceania | Arab |
| Minimum | 2.1% | 3.4% |
| Maximum | 53.8% | 88.0% |
| Range | 51.7% | 84.6% |
| Mean | 19.1% | 24.9% |
| Median | 16.3% | 17.9% |
| Interquartile 25% (IQ1) | 12.4% | 13.7% |
| Interquartile 75% (IQ3) | 21.2% | 33.3% |
| Interquartile Range (IQR) | 8.8% | 19.6% |
| Standard Deviation (Sample) | 12.5% | 17.4% |
| Standard Deviation (Population) | 12.3% | 17.2% |
Similar Demographics by Child Poverty Among Boys Under 16
Demographics Similar to Immigrants from Oceania by Child Poverty Among Boys Under 16
In terms of child poverty among boys under 16, the demographic groups most similar to Immigrants from Oceania are Immigrants from Northern Africa (16.0%, a difference of 0.010%), Guamanian/Chamorro (16.1%, a difference of 0.23%), Costa Rican (16.1%, a difference of 0.43%), Immigrants from Albania (16.1%, a difference of 0.45%), and Immigrants from Chile (15.9%, a difference of 0.52%).
| Demographics | Rating | Rank | Child Poverty Among Boys Under 16 |
| Syrians | 77.5 /100 | #154 | Good 15.9% |
| French Canadians | 76.6 /100 | #155 | Good 15.9% |
| Israelis | 76.5 /100 | #156 | Good 15.9% |
| Immigrants | Nepal | 76.0 /100 | #157 | Good 15.9% |
| Yugoslavians | 75.9 /100 | #158 | Good 15.9% |
| Immigrants | Chile | 74.8 /100 | #159 | Good 15.9% |
| Immigrants | Northern Africa | 71.3 /100 | #160 | Good 16.0% |
| Immigrants | Oceania | 71.3 /100 | #161 | Good 16.0% |
| Guamanians/Chamorros | 69.6 /100 | #162 | Good 16.1% |
| Costa Ricans | 68.1 /100 | #163 | Good 16.1% |
| Immigrants | Albania | 67.9 /100 | #164 | Good 16.1% |
| Colombians | 65.2 /100 | #165 | Good 16.1% |
| Immigrants | Germany | 63.6 /100 | #166 | Good 16.2% |
| Afghans | 55.4 /100 | #167 | Average 16.3% |
| South Americans | 55.3 /100 | #168 | Average 16.3% |
Demographics Similar to Arabs by Child Poverty Among Boys Under 16
In terms of child poverty among boys under 16, the demographic groups most similar to Arabs are Alaska Native (16.8%, a difference of 0.17%), Immigrants from Morocco (16.7%, a difference of 0.42%), Immigrants from South America (16.7%, a difference of 0.81%), Immigrants from Costa Rica (16.7%, a difference of 0.82%), and Hmong (16.6%, a difference of 0.90%).
| Demographics | Rating | Rank | Child Poverty Among Boys Under 16 |
| Kenyans | 41.0 /100 | #183 | Average 16.6% |
| Celtics | 40.6 /100 | #184 | Average 16.6% |
| Immigrants | Western Asia | 40.4 /100 | #185 | Average 16.6% |
| Hmong | 38.4 /100 | #186 | Fair 16.6% |
| Immigrants | Costa Rica | 37.8 /100 | #187 | Fair 16.7% |
| Immigrants | South America | 37.7 /100 | #188 | Fair 16.7% |
| Immigrants | Morocco | 34.5 /100 | #189 | Fair 16.7% |
| Arabs | 31.1 /100 | #190 | Fair 16.8% |
| Alaska Natives | 29.8 /100 | #191 | Fair 16.8% |
| Immigrants | Uganda | 21.6 /100 | #192 | Fair 17.0% |
| Immigrants | Iraq | 21.6 /100 | #193 | Fair 17.0% |
| Immigrants | Lebanon | 21.2 /100 | #194 | Fair 17.0% |
| Spanish | 20.8 /100 | #195 | Fair 17.0% |
| Spaniards | 20.5 /100 | #196 | Fair 17.1% |
| Immigrants | Kenya | 20.1 /100 | #197 | Fair 17.1% |