Immigrants from Norway vs Ottawa Female Poverty Among 18-24 Year Olds
COMPARE
Immigrants from Norway
Ottawa
Female Poverty Among 18-24 Year Olds
Female Poverty Among 18-24 Year Olds Comparison
Immigrants from Norway
Ottawa
21.4%
FEMALE POVERTY AMONG 18-24 YEAR OLDS
0.6/ 100
METRIC RATING
260th/ 347
METRIC RANK
22.0%
FEMALE POVERTY AMONG 18-24 YEAR OLDS
0.0/ 100
METRIC RATING
285th/ 347
METRIC RANK
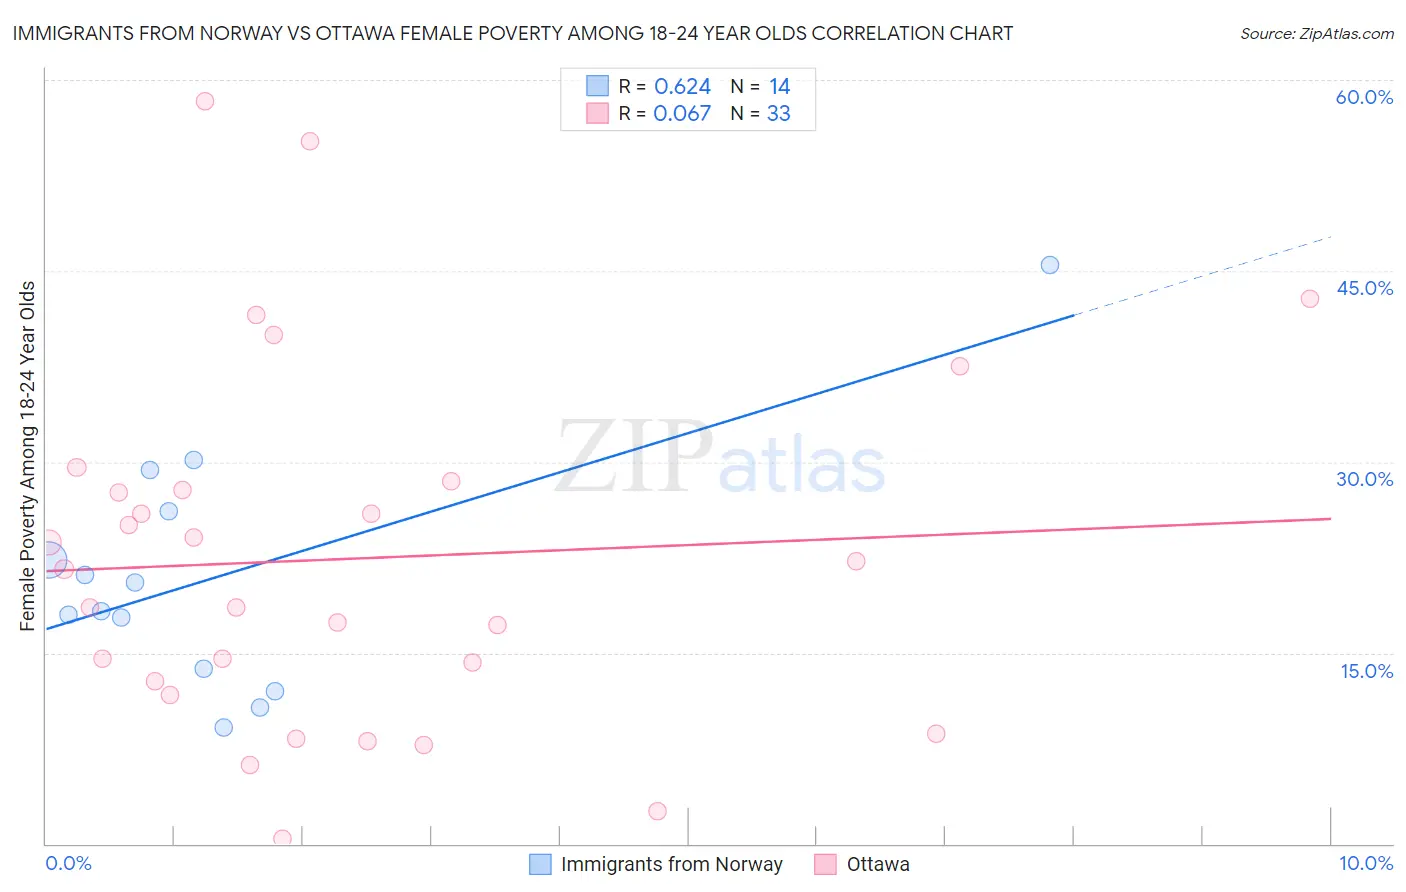
Immigrants from Norway vs Ottawa Female Poverty Among 18-24 Year Olds Correlation Chart
The statistical analysis conducted on geographies consisting of 115,295,513 people shows a significant positive correlation between the proportion of Immigrants from Norway and poverty level among females between the ages 18 and 24 in the United States with a correlation coefficient (R) of 0.624 and weighted average of 21.4%. Similarly, the statistical analysis conducted on geographies consisting of 49,589,208 people shows a slight positive correlation between the proportion of Ottawa and poverty level among females between the ages 18 and 24 in the United States with a correlation coefficient (R) of 0.067 and weighted average of 22.0%, a difference of 3.1%.
Female Poverty Among 18-24 Year Olds Correlation Summary
| Measurement | Immigrants from Norway | Ottawa |
| Minimum | 9.1% | 0.42% |
| Maximum | 45.5% | 58.3% |
| Range | 36.4% | 57.9% |
| Mean | 21.0% | 22.4% |
| Median | 19.4% | 21.6% |
| Interquartile 25% (IQ1) | 13.8% | 12.2% |
| Interquartile 75% (IQ3) | 26.1% | 28.1% |
| Interquartile Range (IQR) | 12.3% | 15.9% |
| Standard Deviation (Sample) | 9.6% | 14.0% |
| Standard Deviation (Population) | 9.2% | 13.8% |
Similar Demographics by Female Poverty Among 18-24 Year Olds
Demographics Similar to Immigrants from Norway by Female Poverty Among 18-24 Year Olds
In terms of female poverty among 18-24 year olds, the demographic groups most similar to Immigrants from Norway are Immigrants from France (21.4%, a difference of 0.050%), Immigrants from Bahamas (21.4%, a difference of 0.070%), Vietnamese (21.4%, a difference of 0.080%), Immigrants from Eastern Africa (21.4%, a difference of 0.26%), and Taiwanese (21.2%, a difference of 0.62%).
| Demographics | Rating | Rank | Female Poverty Among 18-24 Year Olds |
| Delaware | 1.6 /100 | #253 | Tragic 21.1% |
| British West Indians | 1.2 /100 | #254 | Tragic 21.2% |
| Immigrants | Grenada | 1.2 /100 | #255 | Tragic 21.2% |
| Tsimshian | 1.0 /100 | #256 | Tragic 21.2% |
| Taiwanese | 1.0 /100 | #257 | Tragic 21.2% |
| Vietnamese | 0.6 /100 | #258 | Tragic 21.4% |
| Immigrants | France | 0.6 /100 | #259 | Tragic 21.4% |
| Immigrants | Norway | 0.6 /100 | #260 | Tragic 21.4% |
| Immigrants | Bahamas | 0.5 /100 | #261 | Tragic 21.4% |
| Immigrants | Eastern Africa | 0.4 /100 | #262 | Tragic 21.4% |
| Icelanders | 0.3 /100 | #263 | Tragic 21.5% |
| Hondurans | 0.3 /100 | #264 | Tragic 21.5% |
| Immigrants | Nonimmigrants | 0.3 /100 | #265 | Tragic 21.5% |
| Alaska Natives | 0.3 /100 | #266 | Tragic 21.5% |
| Americans | 0.3 /100 | #267 | Tragic 21.6% |
Demographics Similar to Ottawa by Female Poverty Among 18-24 Year Olds
In terms of female poverty among 18-24 year olds, the demographic groups most similar to Ottawa are Tlingit-Haida (22.0%, a difference of 0.12%), Subsaharan African (22.0%, a difference of 0.13%), Ugandan (22.1%, a difference of 0.19%), Immigrants from Middle Africa (22.1%, a difference of 0.20%), and Bermudan (21.9%, a difference of 0.43%).
| Demographics | Rating | Rank | Female Poverty Among 18-24 Year Olds |
| Yaqui | 0.1 /100 | #278 | Tragic 21.9% |
| Spanish Americans | 0.1 /100 | #279 | Tragic 21.9% |
| Immigrants | Dominica | 0.1 /100 | #280 | Tragic 21.9% |
| Immigrants | Dominican Republic | 0.1 /100 | #281 | Tragic 21.9% |
| Bermudans | 0.1 /100 | #282 | Tragic 21.9% |
| Sub-Saharan Africans | 0.0 /100 | #283 | Tragic 22.0% |
| Tlingit-Haida | 0.0 /100 | #284 | Tragic 22.0% |
| Ottawa | 0.0 /100 | #285 | Tragic 22.0% |
| Ugandans | 0.0 /100 | #286 | Tragic 22.1% |
| Immigrants | Middle Africa | 0.0 /100 | #287 | Tragic 22.1% |
| Dominicans | 0.0 /100 | #288 | Tragic 22.3% |
| French American Indians | 0.0 /100 | #289 | Tragic 22.3% |
| Immigrants | Senegal | 0.0 /100 | #290 | Tragic 22.4% |
| Bangladeshis | 0.0 /100 | #291 | Tragic 22.5% |
| Alaskan Athabascans | 0.0 /100 | #292 | Tragic 22.5% |