Immigrants from Norway vs Immigrants from Northern Europe Female Poverty Among 18-24 Year Olds
COMPARE
Immigrants from Norway
Immigrants from Northern Europe
Female Poverty Among 18-24 Year Olds
Female Poverty Among 18-24 Year Olds Comparison
Immigrants from Norway
Immigrants from Northern Europe
21.4%
FEMALE POVERTY AMONG 18-24 YEAR OLDS
0.6/ 100
METRIC RATING
260th/ 347
METRIC RANK
19.4%
FEMALE POVERTY AMONG 18-24 YEAR OLDS
95.4/ 100
METRIC RATING
120th/ 347
METRIC RANK
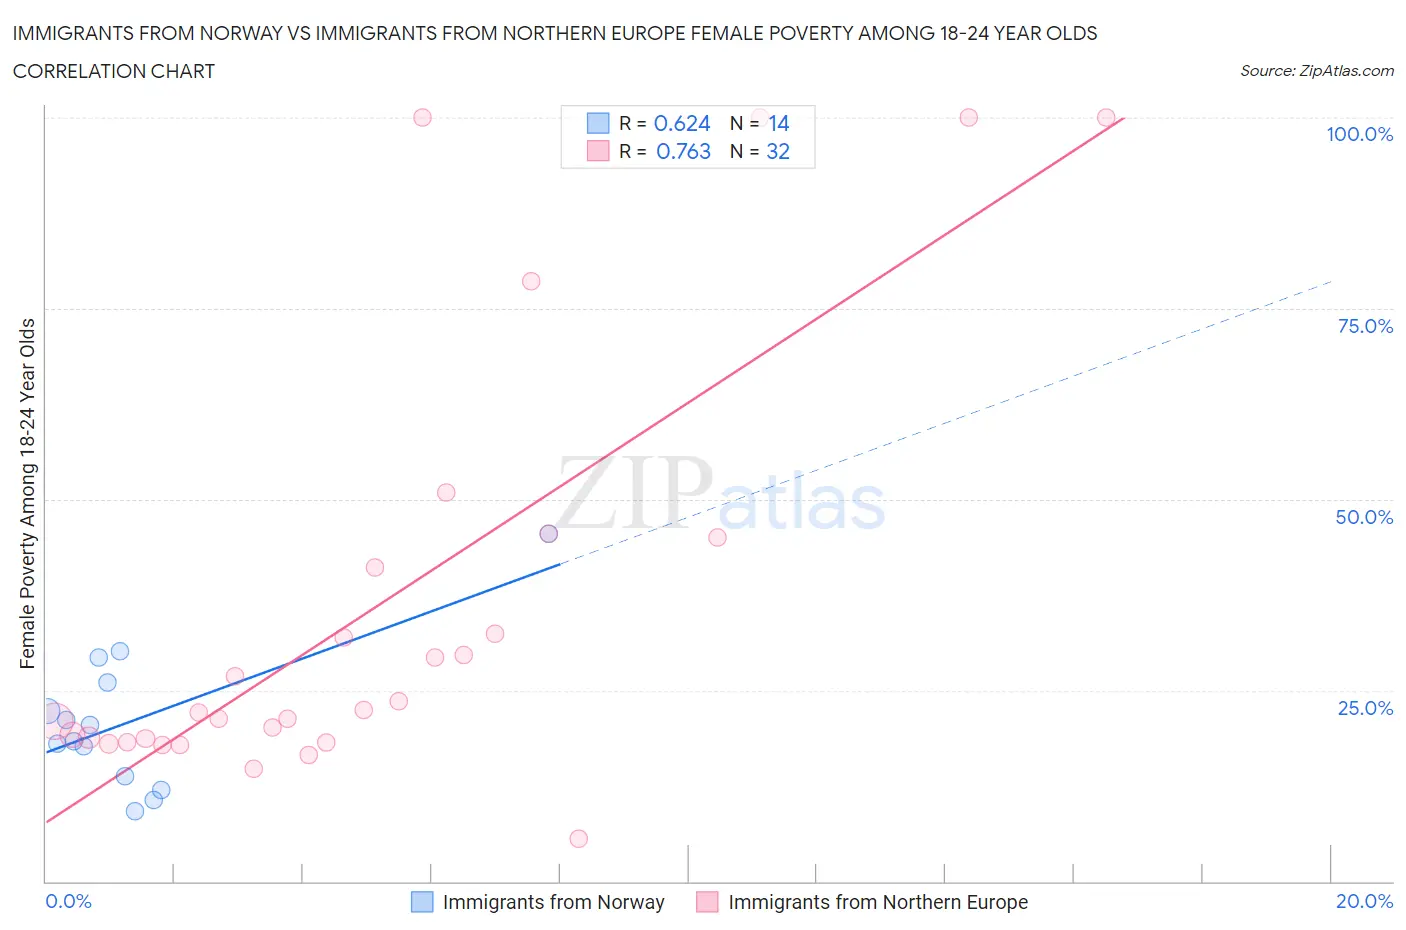
Immigrants from Norway vs Immigrants from Northern Europe Female Poverty Among 18-24 Year Olds Correlation Chart
The statistical analysis conducted on geographies consisting of 115,295,513 people shows a significant positive correlation between the proportion of Immigrants from Norway and poverty level among females between the ages 18 and 24 in the United States with a correlation coefficient (R) of 0.624 and weighted average of 21.4%. Similarly, the statistical analysis conducted on geographies consisting of 458,376,761 people shows a strong positive correlation between the proportion of Immigrants from Northern Europe and poverty level among females between the ages 18 and 24 in the United States with a correlation coefficient (R) of 0.763 and weighted average of 19.4%, a difference of 10.4%.
Female Poverty Among 18-24 Year Olds Correlation Summary
| Measurement | Immigrants from Norway | Immigrants from Northern Europe |
| Minimum | 9.1% | 5.6% |
| Maximum | 45.5% | 100.0% |
| Range | 36.4% | 94.4% |
| Mean | 21.0% | 35.8% |
| Median | 19.4% | 22.3% |
| Interquartile 25% (IQ1) | 13.8% | 18.4% |
| Interquartile 75% (IQ3) | 26.1% | 43.0% |
| Interquartile Range (IQR) | 12.3% | 24.6% |
| Standard Deviation (Sample) | 9.6% | 28.1% |
| Standard Deviation (Population) | 9.2% | 27.7% |
Similar Demographics by Female Poverty Among 18-24 Year Olds
Demographics Similar to Immigrants from Norway by Female Poverty Among 18-24 Year Olds
In terms of female poverty among 18-24 year olds, the demographic groups most similar to Immigrants from Norway are Immigrants from France (21.4%, a difference of 0.050%), Immigrants from Bahamas (21.4%, a difference of 0.070%), Vietnamese (21.4%, a difference of 0.080%), Immigrants from Eastern Africa (21.4%, a difference of 0.26%), and Taiwanese (21.2%, a difference of 0.62%).
| Demographics | Rating | Rank | Female Poverty Among 18-24 Year Olds |
| Delaware | 1.6 /100 | #253 | Tragic 21.1% |
| British West Indians | 1.2 /100 | #254 | Tragic 21.2% |
| Immigrants | Grenada | 1.2 /100 | #255 | Tragic 21.2% |
| Tsimshian | 1.0 /100 | #256 | Tragic 21.2% |
| Taiwanese | 1.0 /100 | #257 | Tragic 21.2% |
| Vietnamese | 0.6 /100 | #258 | Tragic 21.4% |
| Immigrants | France | 0.6 /100 | #259 | Tragic 21.4% |
| Immigrants | Norway | 0.6 /100 | #260 | Tragic 21.4% |
| Immigrants | Bahamas | 0.5 /100 | #261 | Tragic 21.4% |
| Immigrants | Eastern Africa | 0.4 /100 | #262 | Tragic 21.4% |
| Icelanders | 0.3 /100 | #263 | Tragic 21.5% |
| Hondurans | 0.3 /100 | #264 | Tragic 21.5% |
| Immigrants | Nonimmigrants | 0.3 /100 | #265 | Tragic 21.5% |
| Alaska Natives | 0.3 /100 | #266 | Tragic 21.5% |
| Americans | 0.3 /100 | #267 | Tragic 21.6% |
Demographics Similar to Immigrants from Northern Europe by Female Poverty Among 18-24 Year Olds
In terms of female poverty among 18-24 year olds, the demographic groups most similar to Immigrants from Northern Europe are Guyanese (19.4%, a difference of 0.020%), Cypriot (19.3%, a difference of 0.040%), Immigrants from Guyana (19.3%, a difference of 0.060%), Immigrants from Iran (19.3%, a difference of 0.12%), and Immigrants (19.3%, a difference of 0.15%).
| Demographics | Rating | Rank | Female Poverty Among 18-24 Year Olds |
| Immigrants | Cameroon | 96.3 /100 | #113 | Exceptional 19.3% |
| Slovenes | 96.2 /100 | #114 | Exceptional 19.3% |
| Immigrants | Hungary | 96.2 /100 | #115 | Exceptional 19.3% |
| Immigrants | Immigrants | 95.9 /100 | #116 | Exceptional 19.3% |
| Immigrants | Iran | 95.8 /100 | #117 | Exceptional 19.3% |
| Immigrants | Guyana | 95.6 /100 | #118 | Exceptional 19.3% |
| Cypriots | 95.5 /100 | #119 | Exceptional 19.3% |
| Immigrants | Northern Europe | 95.4 /100 | #120 | Exceptional 19.4% |
| Guyanese | 95.3 /100 | #121 | Exceptional 19.4% |
| Cambodians | 94.6 /100 | #122 | Exceptional 19.4% |
| Paraguayans | 94.6 /100 | #123 | Exceptional 19.4% |
| Immigrants | Chile | 94.3 /100 | #124 | Exceptional 19.4% |
| Immigrants | Panama | 94.0 /100 | #125 | Exceptional 19.4% |
| Immigrants | Russia | 93.7 /100 | #126 | Exceptional 19.4% |
| Cape Verdeans | 93.6 /100 | #127 | Exceptional 19.4% |