Immigrants from Norway vs Paiute Female Poverty Among 18-24 Year Olds
COMPARE
Immigrants from Norway
Paiute
Female Poverty Among 18-24 Year Olds
Female Poverty Among 18-24 Year Olds Comparison
Immigrants from Norway
Paiute
21.4%
FEMALE POVERTY AMONG 18-24 YEAR OLDS
0.6/ 100
METRIC RATING
260th/ 347
METRIC RANK
23.3%
FEMALE POVERTY AMONG 18-24 YEAR OLDS
0.0/ 100
METRIC RATING
306th/ 347
METRIC RANK
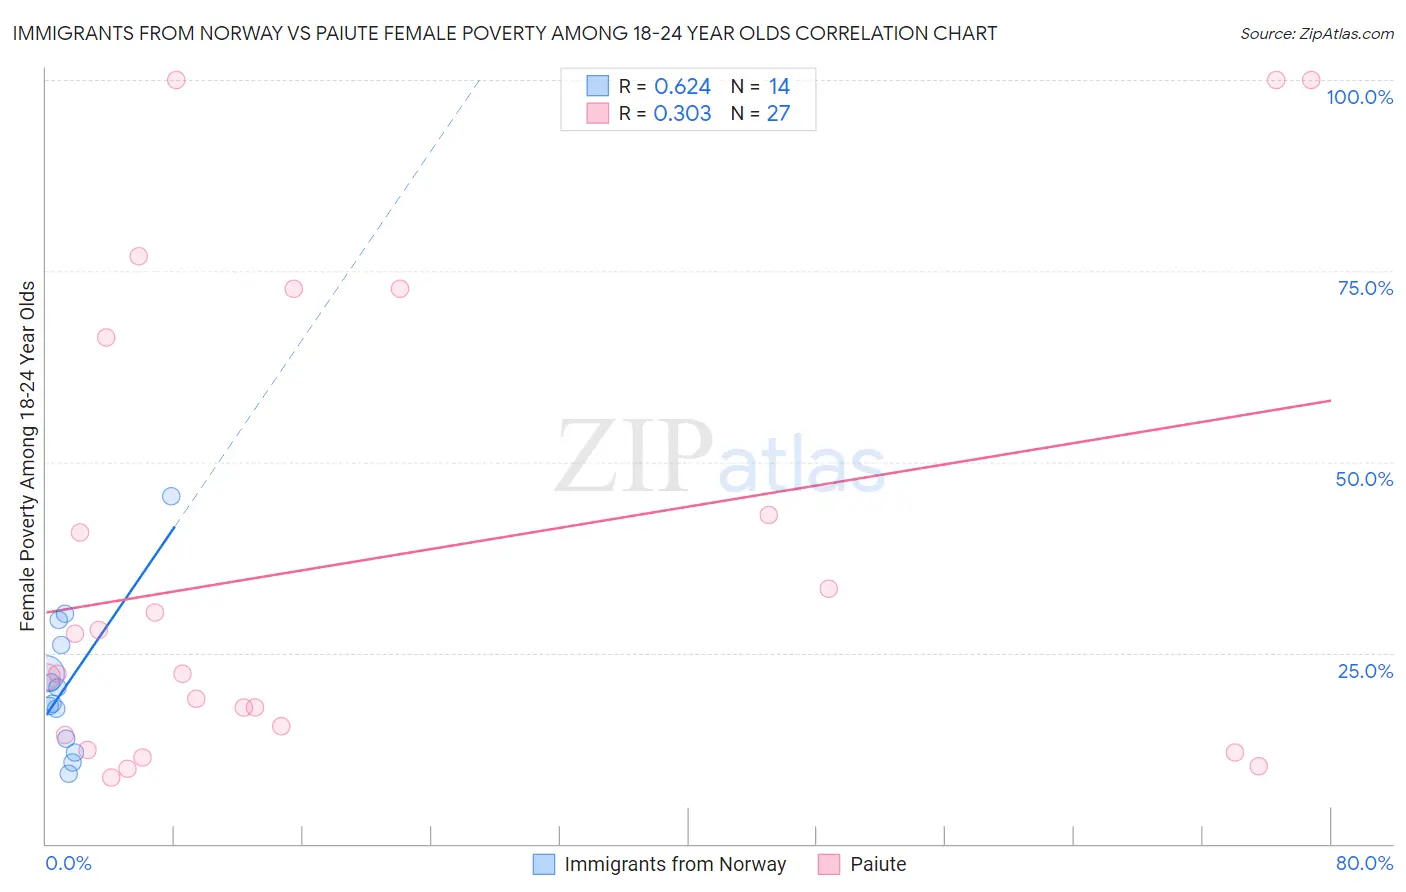
Immigrants from Norway vs Paiute Female Poverty Among 18-24 Year Olds Correlation Chart
The statistical analysis conducted on geographies consisting of 115,295,513 people shows a significant positive correlation between the proportion of Immigrants from Norway and poverty level among females between the ages 18 and 24 in the United States with a correlation coefficient (R) of 0.624 and weighted average of 21.4%. Similarly, the statistical analysis conducted on geographies consisting of 58,137,194 people shows a mild positive correlation between the proportion of Paiute and poverty level among females between the ages 18 and 24 in the United States with a correlation coefficient (R) of 0.303 and weighted average of 23.3%, a difference of 8.9%.
Female Poverty Among 18-24 Year Olds Correlation Summary
| Measurement | Immigrants from Norway | Paiute |
| Minimum | 9.1% | 8.7% |
| Maximum | 45.5% | 100.0% |
| Range | 36.4% | 91.3% |
| Mean | 21.0% | 37.3% |
| Median | 19.4% | 22.2% |
| Interquartile 25% (IQ1) | 13.8% | 14.3% |
| Interquartile 75% (IQ3) | 26.1% | 66.2% |
| Interquartile Range (IQR) | 12.3% | 51.9% |
| Standard Deviation (Sample) | 9.6% | 30.4% |
| Standard Deviation (Population) | 9.2% | 29.8% |
Similar Demographics by Female Poverty Among 18-24 Year Olds
Demographics Similar to Immigrants from Norway by Female Poverty Among 18-24 Year Olds
In terms of female poverty among 18-24 year olds, the demographic groups most similar to Immigrants from Norway are Immigrants from France (21.4%, a difference of 0.050%), Immigrants from Bahamas (21.4%, a difference of 0.070%), Vietnamese (21.4%, a difference of 0.080%), Immigrants from Eastern Africa (21.4%, a difference of 0.26%), and Taiwanese (21.2%, a difference of 0.62%).
| Demographics | Rating | Rank | Female Poverty Among 18-24 Year Olds |
| Delaware | 1.6 /100 | #253 | Tragic 21.1% |
| British West Indians | 1.2 /100 | #254 | Tragic 21.2% |
| Immigrants | Grenada | 1.2 /100 | #255 | Tragic 21.2% |
| Tsimshian | 1.0 /100 | #256 | Tragic 21.2% |
| Taiwanese | 1.0 /100 | #257 | Tragic 21.2% |
| Vietnamese | 0.6 /100 | #258 | Tragic 21.4% |
| Immigrants | France | 0.6 /100 | #259 | Tragic 21.4% |
| Immigrants | Norway | 0.6 /100 | #260 | Tragic 21.4% |
| Immigrants | Bahamas | 0.5 /100 | #261 | Tragic 21.4% |
| Immigrants | Eastern Africa | 0.4 /100 | #262 | Tragic 21.4% |
| Icelanders | 0.3 /100 | #263 | Tragic 21.5% |
| Hondurans | 0.3 /100 | #264 | Tragic 21.5% |
| Immigrants | Nonimmigrants | 0.3 /100 | #265 | Tragic 21.5% |
| Alaska Natives | 0.3 /100 | #266 | Tragic 21.5% |
| Americans | 0.3 /100 | #267 | Tragic 21.6% |
Demographics Similar to Paiute by Female Poverty Among 18-24 Year Olds
In terms of female poverty among 18-24 year olds, the demographic groups most similar to Paiute are Cree (23.4%, a difference of 0.59%), Immigrants from Sudan (23.5%, a difference of 0.94%), Immigrants from Kuwait (23.0%, a difference of 1.1%), Sudanese (23.0%, a difference of 1.2%), and Senegalese (23.0%, a difference of 1.3%).
| Demographics | Rating | Rank | Female Poverty Among 18-24 Year Olds |
| Cherokee | 0.0 /100 | #299 | Tragic 22.7% |
| Africans | 0.0 /100 | #300 | Tragic 22.8% |
| Seminole | 0.0 /100 | #301 | Tragic 22.9% |
| Iroquois | 0.0 /100 | #302 | Tragic 22.9% |
| Senegalese | 0.0 /100 | #303 | Tragic 23.0% |
| Sudanese | 0.0 /100 | #304 | Tragic 23.0% |
| Immigrants | Kuwait | 0.0 /100 | #305 | Tragic 23.0% |
| Paiute | 0.0 /100 | #306 | Tragic 23.3% |
| Cree | 0.0 /100 | #307 | Tragic 23.4% |
| Immigrants | Sudan | 0.0 /100 | #308 | Tragic 23.5% |
| Blackfeet | 0.0 /100 | #309 | Tragic 23.6% |
| Comanche | 0.0 /100 | #310 | Tragic 23.6% |
| Potawatomi | 0.0 /100 | #311 | Tragic 23.7% |
| Yuman | 0.0 /100 | #312 | Tragic 24.0% |
| Creek | 0.0 /100 | #313 | Tragic 24.2% |