Immigrants from Norway vs Immigrants from South Africa Female Poverty Among 18-24 Year Olds

COMPARE

Immigrants from Norway
Race
Ancestry
AfghanAfricanAlaska NativeAlaskan AthabascanAlbanianAleutAlsatianAmericanApacheArabArapahoArgentineanArmenianAssyrian/Chaldean/SyriacAustralianAustrianBahamianBangladeshiBarbadianBasqueBelgianBelizeanBermudanBhutaneseBlackfeetBolivianBrazilianBritishBritish West IndianBulgarianBurmeseCajunCambodianCanadianCape VerdeanCarpatho RusynCelticCentral AmericanCentral American IndianCherokeeCheyenneChickasawChileanChineseChippewaChoctawColombianColvilleComancheCosta RicanCreeCreekCroatianCrowCubanCypriotCzechCzechoslovakianDanishDelawareDominicanDutchDutch West IndianEastern EuropeanEcuadorianEgyptianEnglishEstonianEthiopianEuropeanFijianFilipinoFinnishFrenchFrench American IndianFrench CanadianGermanGerman RussianGhanaianGreekGuamanian/ChamorroGuatemalanGuyaneseHaitianHmongHonduranHopiHoumaHungarianIcelanderIndian (Asian)IndonesianInupiatIranianIraqiIrishIroquoisIsraeliItalianJamaicanJapaneseJordanianKenyanKiowaKoreanLaotianLatvianLebaneseLiberianLithuanianLumbeeLuxembourgerMacedonianMalaysianMalteseMarshalleseMenomineeMexicanMexican American IndianMongolianMoroccanNative HawaiianNavajoNepaleseNew ZealanderNicaraguanNigerianNorthern EuropeanNorwegianOkinawanOsageOttawaPaiutePakistaniPalestinianPanamanianParaguayanPennsylvania GermanPeruvianPimaPolishPortuguesePotawatomiPuebloPuerto RicanPuget Sound SalishRomanianRussianSalvadoranSamoanScandinavianScotch-IrishScottishSeminoleSenegaleseSerbianShoshoneSierra LeoneanSiouxSlavicSlovakSloveneSomaliSouth AfricanSouth AmericanSouth American IndianSoviet UnionSpaniardSpanishSpanish AmericanSpanish American IndianSri LankanSubsaharan AfricanSudaneseSwedishSwissSyrianTaiwaneseThaiTlingit-HaidaTohono O'OdhamTonganTrinidadian and TobagonianTsimshianTurkishU.S. Virgin IslanderUgandanUkrainianUruguayanUteVenezuelanVietnameseWelshWest IndianYakamaYaquiYugoslavianYumanYup'ikZimbabwean
Immigration
NonimmigrantsImmigrantsAfghanistanAfricaAlbaniaArgentinaArmeniaAsiaAustraliaAustriaBahamasBangladeshBarbadosBelarusBelgiumBelizeBoliviaBosnia and HerzegovinaBrazilBulgariaBurma/MyanmarCabo VerdeCambodiaCameroonCanadaCaribbeanCentral AmericaChileChinaColombiaCongoCosta RicaCroatiaCubaCzechoslovakiaDenmarkDominicaDominican RepublicEastern AfricaEastern AsiaEastern EuropeEcuadorEgyptEl SalvadorEnglandEritreaEthiopiaEuropeFijiFranceGermanyGhanaGreeceGrenadaGuatemalaGuyanaHaitiHondurasHong KongHungaryIndiaIndonesiaIranIraqIrelandIsraelItalyJamaicaJapanJordanKazakhstanKenyaKoreaKuwaitLaosLatin AmericaLatviaLebanonLiberiaLithuaniaMalaysiaMexicoMicronesiaMiddle AfricaMoldovaMoroccoNepalNetherlandsNicaraguaNigeriaNorth AmericaNorth MacedoniaNorthern AfricaNorthern EuropeNorwayOceaniaPakistanPanamaPeruPhilippinesPolandPortugalRomaniaRussiaSaudi ArabiaScotlandSenegalSerbiaSierra LeoneSingaporeSomaliaSouth AmericaSouth Central AsiaSouth Eastern AsiaSouthern EuropeSpainSri LankaSt. Vincent and the GrenadinesSudanSwedenSwitzerlandSyriaTaiwanThailandTrinidad and TobagoTurkeyUgandaUkraineUruguayUzbekistanVenezuelaVietnamWest IndiesWestern AfricaWestern AsiaWestern EuropeYemenZaireZimbabweAzores
Immigrants from South Africa
Race
Ancestry
AfghanAfricanAlaska NativeAlaskan AthabascanAlbanianAleutAlsatianAmericanApacheArabArapahoArgentineanArmenianAssyrian/Chaldean/SyriacAustralianAustrianBahamianBangladeshiBarbadianBasqueBelgianBelizeanBermudanBhutaneseBlackfeetBolivianBrazilianBritishBritish West IndianBulgarianBurmeseCajunCambodianCanadianCape VerdeanCarpatho RusynCelticCentral AmericanCentral American IndianCherokeeCheyenneChickasawChileanChineseChippewaChoctawColombianColvilleComancheCosta RicanCreeCreekCroatianCrowCubanCypriotCzechCzechoslovakianDanishDelawareDominicanDutchDutch West IndianEastern EuropeanEcuadorianEgyptianEnglishEstonianEthiopianEuropeanFijianFilipinoFinnishFrenchFrench American IndianFrench CanadianGermanGerman RussianGhanaianGreekGuamanian/ChamorroGuatemalanGuyaneseHaitianHmongHonduranHopiHoumaHungarianIcelanderIndian (Asian)IndonesianInupiatIranianIraqiIrishIroquoisIsraeliItalianJamaicanJapaneseJordanianKenyanKiowaKoreanLaotianLatvianLebaneseLiberianLithuanianLumbeeLuxembourgerMacedonianMalaysianMalteseMarshalleseMenomineeMexicanMexican American IndianMongolianMoroccanNative HawaiianNavajoNepaleseNew ZealanderNicaraguanNigerianNorthern EuropeanNorwegianOkinawanOsageOttawaPaiutePakistaniPalestinianPanamanianParaguayanPennsylvania GermanPeruvianPimaPolishPortuguesePotawatomiPuebloPuerto RicanPuget Sound SalishRomanianRussianSalvadoranSamoanScandinavianScotch-IrishScottishSeminoleSenegaleseSerbianShoshoneSierra LeoneanSiouxSlavicSlovakSloveneSomaliSouth AfricanSouth AmericanSouth American IndianSoviet UnionSpaniardSpanishSpanish AmericanSpanish American IndianSri LankanSubsaharan AfricanSudaneseSwedishSwissSyrianTaiwaneseThaiTlingit-HaidaTohono O'OdhamTonganTrinidadian and TobagonianTsimshianTurkishU.S. Virgin IslanderUgandanUkrainianUruguayanUteVenezuelanVietnameseWelshWest IndianYakamaYaquiYugoslavianYumanYup'ikZimbabwean
Immigration
NonimmigrantsImmigrantsAfghanistanAfricaAlbaniaArgentinaArmeniaAsiaAustraliaAustriaBahamasBangladeshBarbadosBelarusBelgiumBelizeBoliviaBosnia and HerzegovinaBrazilBulgariaBurma/MyanmarCabo VerdeCambodiaCameroonCanadaCaribbeanCentral AmericaChileChinaColombiaCongoCosta RicaCroatiaCubaCzechoslovakiaDenmarkDominicaDominican RepublicEastern AfricaEastern AsiaEastern EuropeEcuadorEgyptEl SalvadorEnglandEritreaEthiopiaEuropeFijiFranceGermanyGhanaGreeceGrenadaGuatemalaGuyanaHaitiHondurasHong KongHungaryIndiaIndonesiaIranIraqIrelandIsraelItalyJamaicaJapanJordanKazakhstanKenyaKoreaKuwaitLaosLatin AmericaLatviaLebanonLiberiaLithuaniaMalaysiaMexicoMicronesiaMiddle AfricaMoldovaMoroccoNepalNetherlandsNicaraguaNigeriaNorth AmericaNorth MacedoniaNorthern AfricaNorthern EuropeOceaniaPakistanPanamaPeruPhilippinesPolandPortugalRomaniaRussiaSaudi ArabiaScotlandSenegalSerbiaSierra LeoneSingaporeSomaliaSouth AfricaSouth AmericaSouth Central AsiaSouth Eastern AsiaSouthern EuropeSpainSri LankaSt. Vincent and the GrenadinesSudanSwedenSwitzerlandSyriaTaiwanThailandTrinidad and TobagoTurkeyUgandaUkraineUruguayUzbekistanVenezuelaVietnamWest IndiesWestern AfricaWestern AsiaWestern EuropeYemenZaireZimbabweAzores
Female Poverty Among 18-24 Year Olds
Income
Poverty
Unemployment
Labor Participation
Family Structure
Vehicle Availability
Education Level
Disability

Female Poverty Among 18-24 Year Olds Comparison

Immigrants from Norway

Immigrants from South Africa

Tragic
Poor
21.4%
FEMALE POVERTY AMONG 18-24 YEAR OLDS
0.6/ 100
METRIC RATING
260th/ 347
METRIC RANK
20.6%
FEMALE POVERTY AMONG 18-24 YEAR OLDS
10.7/ 100
METRIC RATING
214th/ 347
METRIC RANK

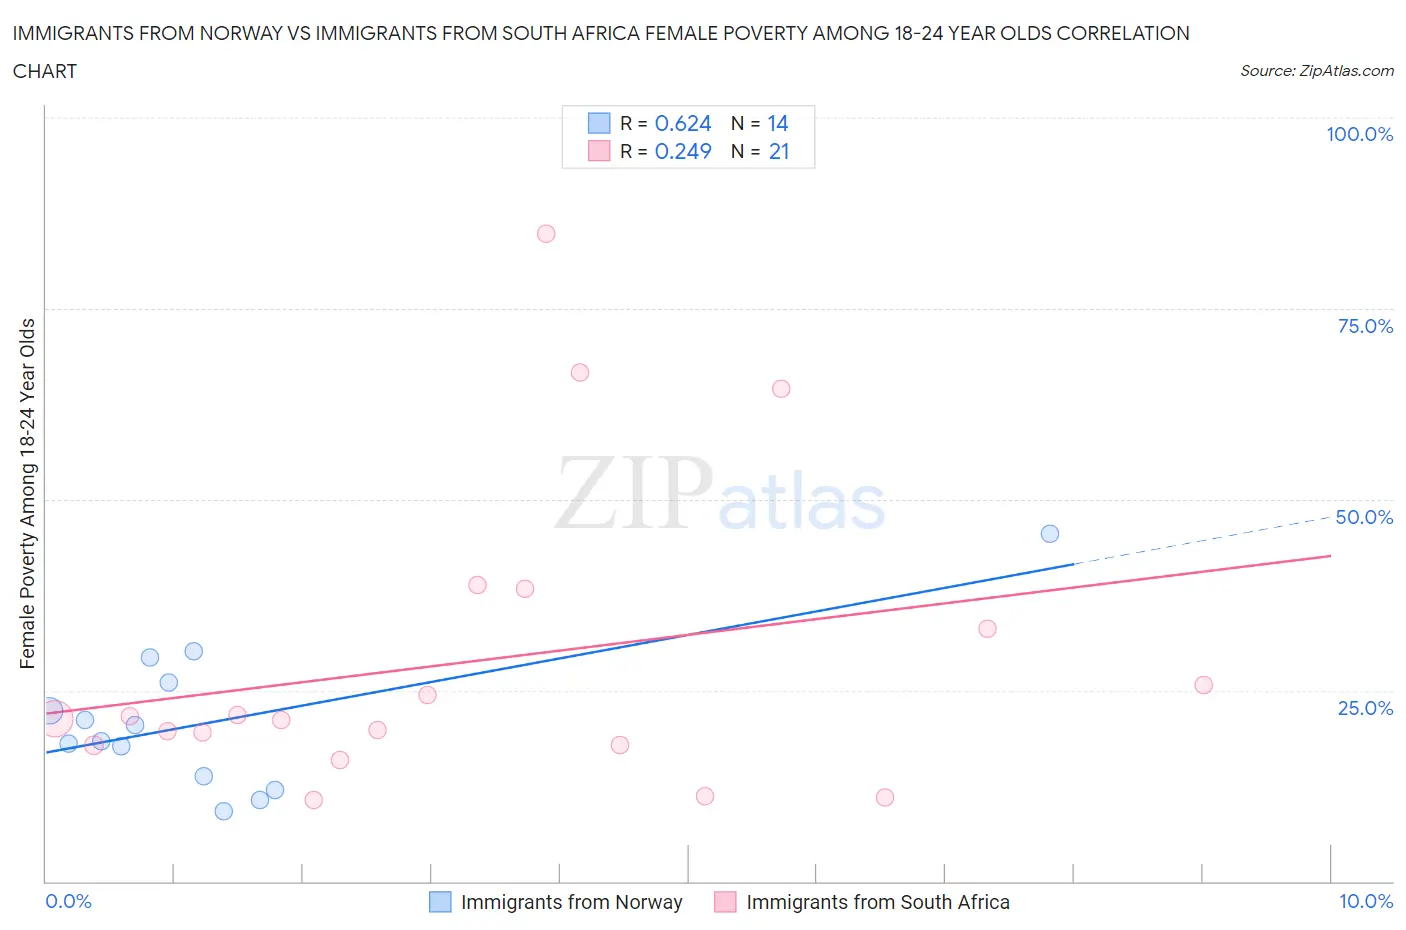
Immigrants from Norway vs Immigrants from South Africa Female Poverty Among 18-24 Year Olds Correlation Chart

The statistical analysis conducted on geographies consisting of 115,295,513 people shows a significant positive correlation between the proportion of Immigrants from Norway and poverty level among females between the ages 18 and 24 in the United States with a correlation coefficient (R) of 0.624 and weighted average of 21.4%. Similarly, the statistical analysis conducted on geographies consisting of 229,352,607 people shows a weak positive correlation between the proportion of Immigrants from South Africa and poverty level among females between the ages 18 and 24 in the United States with a correlation coefficient (R) of 0.249 and weighted average of 20.6%, a difference of 3.6%.
Immigrants from Norway vs Immigrants from South Africa Female Poverty Among 18-24 Year Olds

Female Poverty Among 18-24 Year Olds Correlation Summary

MeasurementImmigrants from NorwayImmigrants from South Africa
Minimum9.1%10.6%
Maximum45.5%84.8%
Range36.4%74.2%
Mean21.0%28.8%
Median19.4%21.3%
Interquartile 25% (IQ1)13.8%17.8%
Interquartile 75% (IQ3)26.1%35.7%
Interquartile Range (IQR)12.3%17.9%
Standard Deviation (Sample)9.6%19.9%
Standard Deviation (Population)9.2%19.4%

Similar Demographics by Female Poverty Among 18-24 Year Olds

Demographics Similar to Immigrants from Norway by Female Poverty Among 18-24 Year Olds

In terms of female poverty among 18-24 year olds, the demographic groups most similar to Immigrants from Norway are Immigrants from France (21.4%, a difference of 0.050%), Immigrants from Bahamas (21.4%, a difference of 0.070%), Vietnamese (21.4%, a difference of 0.080%), Immigrants from Eastern Africa (21.4%, a difference of 0.26%), and Taiwanese (21.2%, a difference of 0.62%).
DemographicsRating | RankFemale Poverty Among 18-24 Year Olds
Delaware
1.6
/100
|
#253
Tragic
21.1%
British West Indians
1.2
/100
|
#254
Tragic
21.2%
Immigrants | Grenada
1.2
/100
|
#255
Tragic
21.2%
Tsimshian
1.0
/100
|
#256
Tragic
21.2%
Taiwanese
1.0
/100
|
#257
Tragic
21.2%
Vietnamese
0.6
/100
|
#258
Tragic
21.4%
Immigrants | France
0.6
/100
|
#259
Tragic
21.4%
Immigrants | Norway
0.6
/100
|
#260
Tragic
21.4%
Immigrants | Bahamas
0.5
/100
|
#261
Tragic
21.4%
Immigrants | Eastern Africa
0.4
/100
|
#262
Tragic
21.4%
Icelanders
0.3
/100
|
#263
Tragic
21.5%
Hondurans
0.3
/100
|
#264
Tragic
21.5%
Immigrants | Nonimmigrants
0.3
/100
|
#265
Tragic
21.5%
Alaska Natives
0.3
/100
|
#266
Tragic
21.5%
Americans
0.3
/100
|
#267
Tragic
21.6%

Demographics Similar to Immigrants from South Africa by Female Poverty Among 18-24 Year Olds

In terms of female poverty among 18-24 year olds, the demographic groups most similar to Immigrants from South Africa are Spanish (20.6%, a difference of 0.040%), Immigrants from Western Africa (20.6%, a difference of 0.050%), Northern European (20.6%, a difference of 0.11%), Liberian (20.6%, a difference of 0.12%), and Immigrants from Laos (20.6%, a difference of 0.13%).
DemographicsRating | RankFemale Poverty Among 18-24 Year Olds
Spaniards
16.3
/100
|
#207
Poor
20.5%
Dutch
15.9
/100
|
#208
Poor
20.5%
Arabs
15.5
/100
|
#209
Poor
20.5%
Immigrants | Ghana
14.3
/100
|
#210
Poor
20.5%
Immigrants | Western Europe
13.5
/100
|
#211
Poor
20.6%
Liberians
11.6
/100
|
#212
Poor
20.6%
Northern Europeans
11.6
/100
|
#213
Poor
20.6%
Immigrants | South Africa
10.7
/100
|
#214
Poor
20.6%
Spanish
10.4
/100
|
#215
Poor
20.6%
Immigrants | Western Africa
10.2
/100
|
#216
Poor
20.6%
Immigrants | Laos
9.7
/100
|
#217
Tragic
20.6%
Immigrants | Nepal
9.6
/100
|
#218
Tragic
20.7%
Immigrants | Micronesia
9.6
/100
|
#219
Tragic
20.7%
British
9.4
/100
|
#220
Tragic
20.7%
Barbadians
9.0
/100
|
#221
Tragic
20.7%