Cherokee vs Immigrants from Northern Europe Female Poverty Among 18-24 Year Olds
COMPARE
Cherokee
Immigrants from Northern Europe
Female Poverty Among 18-24 Year Olds
Female Poverty Among 18-24 Year Olds Comparison
Cherokee
Immigrants from Northern Europe
22.7%
FEMALE POVERTY AMONG 18-24 YEAR OLDS
0.0/ 100
METRIC RATING
299th/ 347
METRIC RANK
19.4%
FEMALE POVERTY AMONG 18-24 YEAR OLDS
95.4/ 100
METRIC RATING
120th/ 347
METRIC RANK
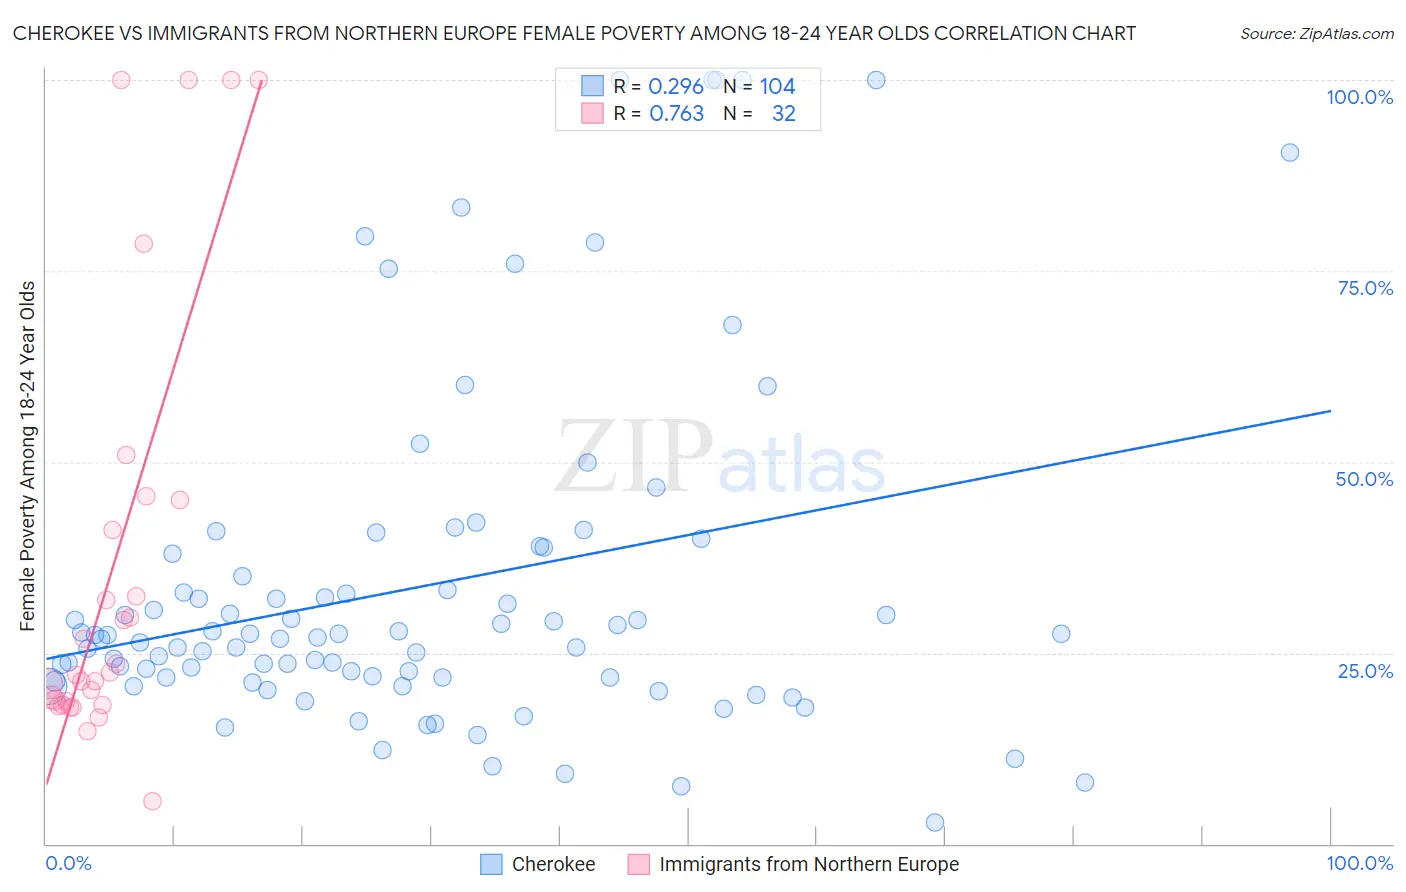
Cherokee vs Immigrants from Northern Europe Female Poverty Among 18-24 Year Olds Correlation Chart
The statistical analysis conducted on geographies consisting of 476,487,682 people shows a weak positive correlation between the proportion of Cherokee and poverty level among females between the ages 18 and 24 in the United States with a correlation coefficient (R) of 0.296 and weighted average of 22.7%. Similarly, the statistical analysis conducted on geographies consisting of 458,376,761 people shows a strong positive correlation between the proportion of Immigrants from Northern Europe and poverty level among females between the ages 18 and 24 in the United States with a correlation coefficient (R) of 0.763 and weighted average of 19.4%, a difference of 17.2%.
Female Poverty Among 18-24 Year Olds Correlation Summary
| Measurement | Cherokee | Immigrants from Northern Europe |
| Minimum | 2.7% | 5.6% |
| Maximum | 100.0% | 100.0% |
| Range | 97.3% | 94.4% |
| Mean | 33.7% | 35.8% |
| Median | 27.2% | 22.3% |
| Interquartile 25% (IQ1) | 21.8% | 18.4% |
| Interquartile 75% (IQ3) | 36.5% | 43.0% |
| Interquartile Range (IQR) | 14.8% | 24.6% |
| Standard Deviation (Sample) | 22.2% | 28.1% |
| Standard Deviation (Population) | 22.1% | 27.7% |
Similar Demographics by Female Poverty Among 18-24 Year Olds
Demographics Similar to Cherokee by Female Poverty Among 18-24 Year Olds
In terms of female poverty among 18-24 year olds, the demographic groups most similar to Cherokee are Central American Indian (22.6%, a difference of 0.41%), Inupiat (22.6%, a difference of 0.47%), Menominee (22.5%, a difference of 0.62%), Shoshone (22.5%, a difference of 0.72%), and African (22.8%, a difference of 0.72%).
| Demographics | Rating | Rank | Female Poverty Among 18-24 Year Olds |
| Alaskan Athabascans | 0.0 /100 | #292 | Tragic 22.5% |
| U.S. Virgin Islanders | 0.0 /100 | #293 | Tragic 22.5% |
| Indonesians | 0.0 /100 | #294 | Tragic 22.5% |
| Shoshone | 0.0 /100 | #295 | Tragic 22.5% |
| Menominee | 0.0 /100 | #296 | Tragic 22.5% |
| Inupiat | 0.0 /100 | #297 | Tragic 22.6% |
| Central American Indians | 0.0 /100 | #298 | Tragic 22.6% |
| Cherokee | 0.0 /100 | #299 | Tragic 22.7% |
| Africans | 0.0 /100 | #300 | Tragic 22.8% |
| Seminole | 0.0 /100 | #301 | Tragic 22.9% |
| Iroquois | 0.0 /100 | #302 | Tragic 22.9% |
| Senegalese | 0.0 /100 | #303 | Tragic 23.0% |
| Sudanese | 0.0 /100 | #304 | Tragic 23.0% |
| Immigrants | Kuwait | 0.0 /100 | #305 | Tragic 23.0% |
| Paiute | 0.0 /100 | #306 | Tragic 23.3% |
Demographics Similar to Immigrants from Northern Europe by Female Poverty Among 18-24 Year Olds
In terms of female poverty among 18-24 year olds, the demographic groups most similar to Immigrants from Northern Europe are Guyanese (19.4%, a difference of 0.020%), Cypriot (19.3%, a difference of 0.040%), Immigrants from Guyana (19.3%, a difference of 0.060%), Immigrants from Iran (19.3%, a difference of 0.12%), and Immigrants (19.3%, a difference of 0.15%).
| Demographics | Rating | Rank | Female Poverty Among 18-24 Year Olds |
| Immigrants | Cameroon | 96.3 /100 | #113 | Exceptional 19.3% |
| Slovenes | 96.2 /100 | #114 | Exceptional 19.3% |
| Immigrants | Hungary | 96.2 /100 | #115 | Exceptional 19.3% |
| Immigrants | Immigrants | 95.9 /100 | #116 | Exceptional 19.3% |
| Immigrants | Iran | 95.8 /100 | #117 | Exceptional 19.3% |
| Immigrants | Guyana | 95.6 /100 | #118 | Exceptional 19.3% |
| Cypriots | 95.5 /100 | #119 | Exceptional 19.3% |
| Immigrants | Northern Europe | 95.4 /100 | #120 | Exceptional 19.4% |
| Guyanese | 95.3 /100 | #121 | Exceptional 19.4% |
| Cambodians | 94.6 /100 | #122 | Exceptional 19.4% |
| Paraguayans | 94.6 /100 | #123 | Exceptional 19.4% |
| Immigrants | Chile | 94.3 /100 | #124 | Exceptional 19.4% |
| Immigrants | Panama | 94.0 /100 | #125 | Exceptional 19.4% |
| Immigrants | Russia | 93.7 /100 | #126 | Exceptional 19.4% |
| Cape Verdeans | 93.6 /100 | #127 | Exceptional 19.4% |