Immigrants from Norway vs Cuban Male Poverty
COMPARE
Immigrants from Norway
Cuban
Male Poverty
Male Poverty Comparison
Immigrants from Norway
Cubans
10.7%
MALE POVERTY
86.0/ 100
METRIC RATING
125th/ 347
METRIC RANK
12.4%
MALE POVERTY
1.3/ 100
METRIC RATING
229th/ 347
METRIC RANK
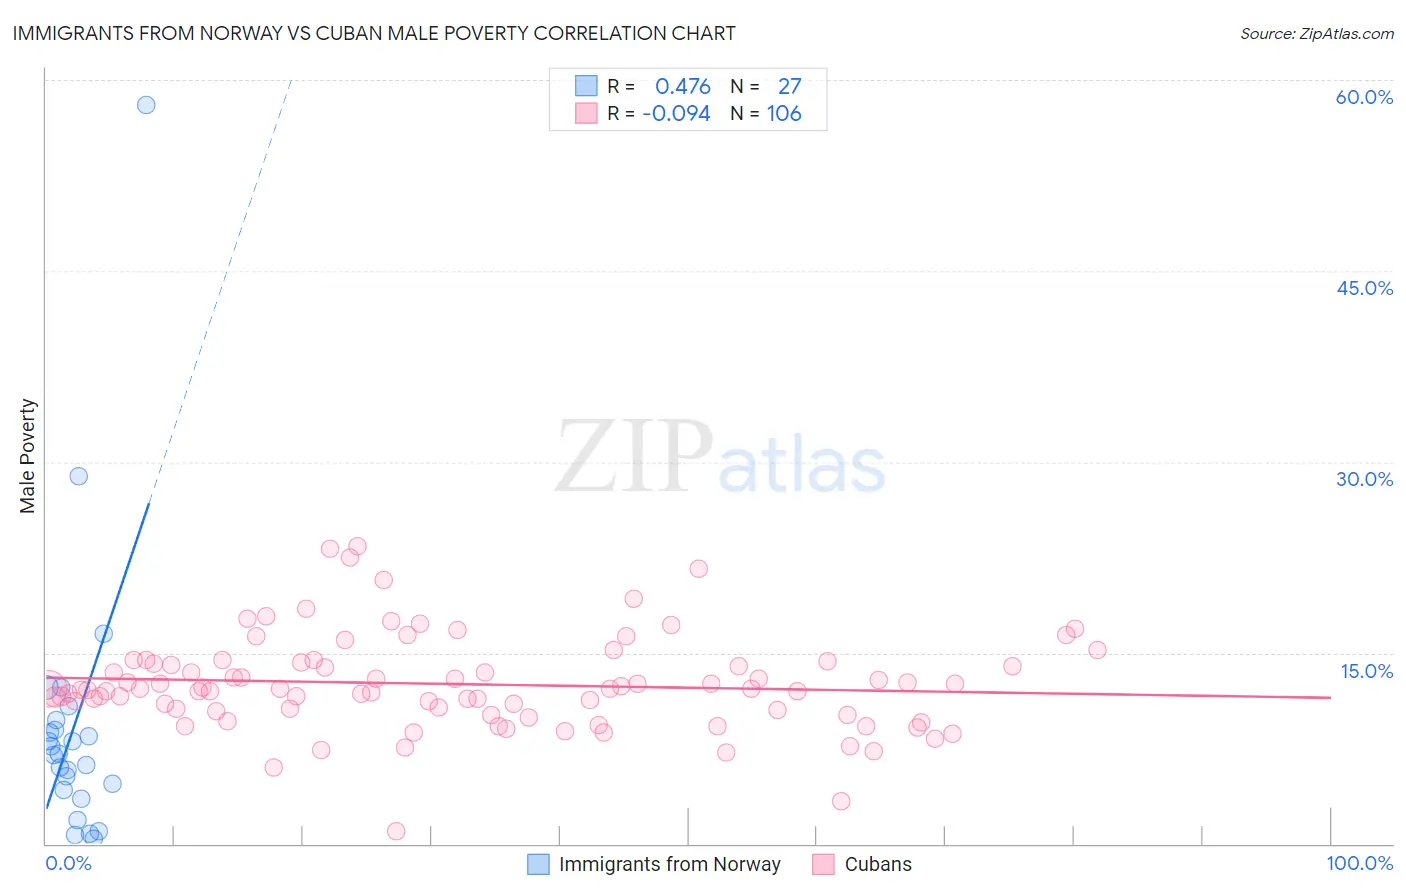
Immigrants from Norway vs Cuban Male Poverty Correlation Chart
The statistical analysis conducted on geographies consisting of 116,684,379 people shows a moderate positive correlation between the proportion of Immigrants from Norway and poverty level among males in the United States with a correlation coefficient (R) of 0.476 and weighted average of 10.7%. Similarly, the statistical analysis conducted on geographies consisting of 448,765,698 people shows a slight negative correlation between the proportion of Cubans and poverty level among males in the United States with a correlation coefficient (R) of -0.094 and weighted average of 12.4%, a difference of 15.8%.
Male Poverty Correlation Summary
| Measurement | Immigrants from Norway | Cuban |
| Minimum | 0.44% | 0.97% |
| Maximum | 58.1% | 23.3% |
| Range | 57.6% | 22.4% |
| Mean | 9.4% | 12.5% |
| Median | 7.1% | 12.2% |
| Interquartile 25% (IQ1) | 4.2% | 10.5% |
| Interquartile 75% (IQ3) | 9.7% | 14.2% |
| Interquartile Range (IQR) | 5.6% | 3.8% |
| Standard Deviation (Sample) | 11.3% | 3.7% |
| Standard Deviation (Population) | 11.1% | 3.7% |
Similar Demographics by Male Poverty
Demographics Similar to Immigrants from Norway by Male Poverty
In terms of male poverty, the demographic groups most similar to Immigrants from Norway are French (10.7%, a difference of 0.15%), South African (10.7%, a difference of 0.18%), Native Hawaiian (10.7%, a difference of 0.22%), Peruvian (10.7%, a difference of 0.23%), and Immigrants from China (10.7%, a difference of 0.25%).
| Demographics | Rating | Rank | Male Poverty |
| Okinawans | 87.6 /100 | #118 | Excellent 10.7% |
| Immigrants | Hungary | 87.6 /100 | #119 | Excellent 10.7% |
| Immigrants | China | 87.1 /100 | #120 | Excellent 10.7% |
| Peruvians | 87.1 /100 | #121 | Excellent 10.7% |
| Native Hawaiians | 87.0 /100 | #122 | Excellent 10.7% |
| South Africans | 86.8 /100 | #123 | Excellent 10.7% |
| French | 86.7 /100 | #124 | Excellent 10.7% |
| Immigrants | Norway | 86.0 /100 | #125 | Excellent 10.7% |
| Immigrants | Ukraine | 84.3 /100 | #126 | Excellent 10.7% |
| Puget Sound Salish | 84.3 /100 | #127 | Excellent 10.7% |
| Immigrants | Western Europe | 84.2 /100 | #128 | Excellent 10.7% |
| Immigrants | Peru | 84.1 /100 | #129 | Excellent 10.7% |
| Chileans | 83.9 /100 | #130 | Excellent 10.7% |
| Immigrants | Belarus | 83.3 /100 | #131 | Excellent 10.7% |
| Immigrants | Vietnam | 83.0 /100 | #132 | Excellent 10.8% |
Demographics Similar to Cubans by Male Poverty
In terms of male poverty, the demographic groups most similar to Cubans are Alsatian (12.4%, a difference of 0.090%), Alaska Native (12.4%, a difference of 0.13%), Nigerian (12.3%, a difference of 0.23%), Osage (12.3%, a difference of 0.39%), and Immigrants from Nigeria (12.3%, a difference of 0.45%).
| Demographics | Rating | Rank | Male Poverty |
| Immigrants | Africa | 2.1 /100 | #222 | Tragic 12.2% |
| Immigrants | Micronesia | 2.1 /100 | #223 | Tragic 12.2% |
| Immigrants | Nigeria | 1.6 /100 | #224 | Tragic 12.3% |
| Osage | 1.5 /100 | #225 | Tragic 12.3% |
| Nigerians | 1.4 /100 | #226 | Tragic 12.3% |
| Alaska Natives | 1.4 /100 | #227 | Tragic 12.4% |
| Alsatians | 1.3 /100 | #228 | Tragic 12.4% |
| Cubans | 1.3 /100 | #229 | Tragic 12.4% |
| Marshallese | 0.8 /100 | #230 | Tragic 12.5% |
| Salvadorans | 0.6 /100 | #231 | Tragic 12.6% |
| Nicaraguans | 0.6 /100 | #232 | Tragic 12.6% |
| Fijians | 0.6 /100 | #233 | Tragic 12.6% |
| Immigrants | Armenia | 0.6 /100 | #234 | Tragic 12.6% |
| Immigrants | Laos | 0.5 /100 | #235 | Tragic 12.6% |
| Immigrants | Saudi Arabia | 0.4 /100 | #236 | Tragic 12.7% |