Immigrants from Belize vs Cuban Male Poverty
COMPARE
Immigrants from Belize
Cuban
Male Poverty
Male Poverty Comparison
Immigrants from Belize
Cubans
13.8%
MALE POVERTY
0.0/ 100
METRIC RATING
293rd/ 347
METRIC RANK
12.4%
MALE POVERTY
1.3/ 100
METRIC RATING
229th/ 347
METRIC RANK
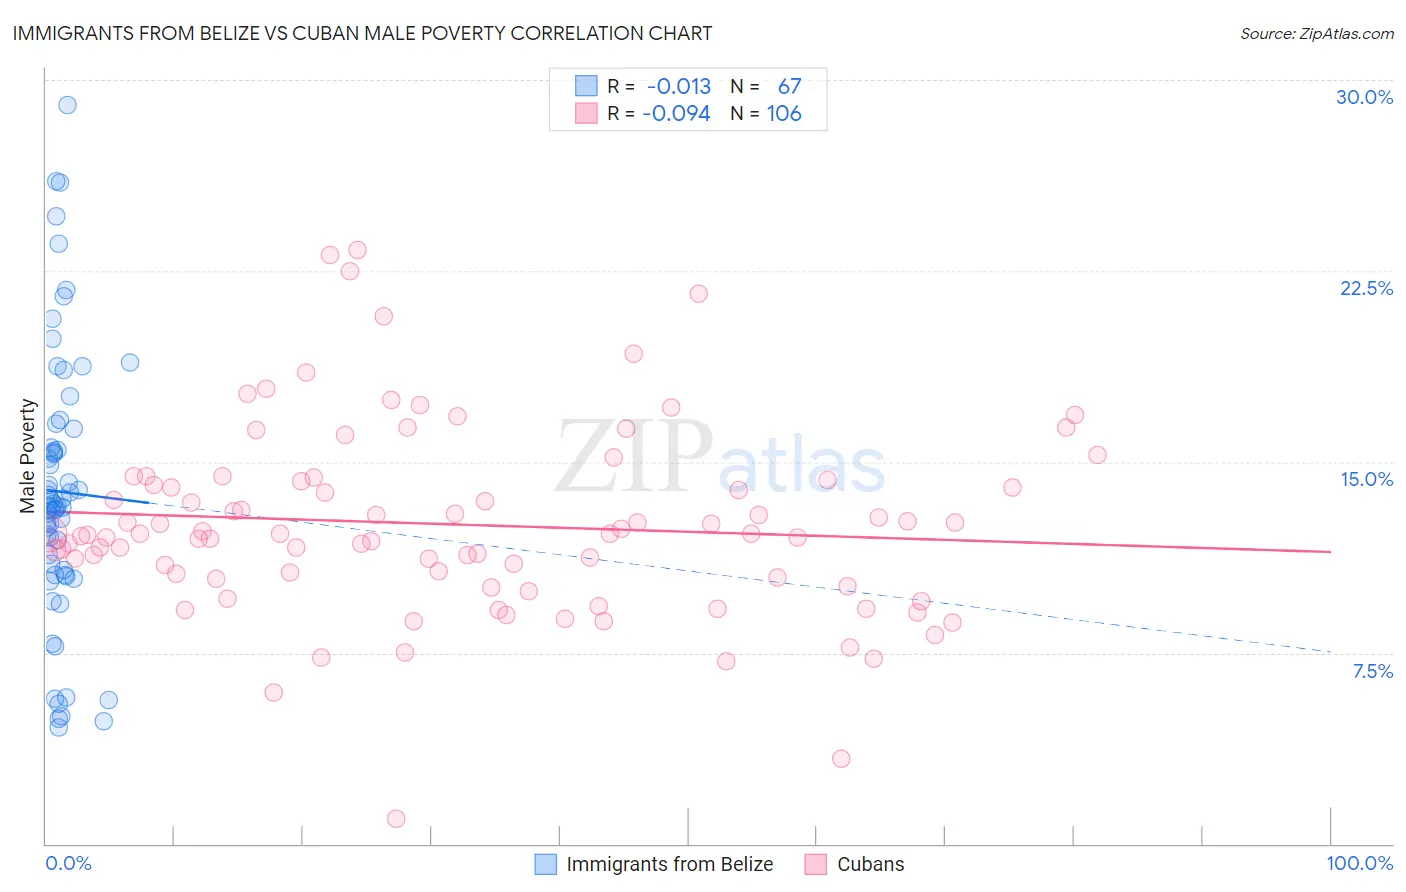
Immigrants from Belize vs Cuban Male Poverty Correlation Chart
The statistical analysis conducted on geographies consisting of 130,288,128 people shows no correlation between the proportion of Immigrants from Belize and poverty level among males in the United States with a correlation coefficient (R) of -0.013 and weighted average of 13.8%. Similarly, the statistical analysis conducted on geographies consisting of 448,765,698 people shows a slight negative correlation between the proportion of Cubans and poverty level among males in the United States with a correlation coefficient (R) of -0.094 and weighted average of 12.4%, a difference of 11.9%.
Male Poverty Correlation Summary
| Measurement | Immigrants from Belize | Cuban |
| Minimum | 4.6% | 0.97% |
| Maximum | 29.0% | 23.3% |
| Range | 24.4% | 22.4% |
| Mean | 13.8% | 12.5% |
| Median | 13.2% | 12.2% |
| Interquartile 25% (IQ1) | 10.6% | 10.5% |
| Interquartile 75% (IQ3) | 16.3% | 14.2% |
| Interquartile Range (IQR) | 5.7% | 3.8% |
| Standard Deviation (Sample) | 5.4% | 3.7% |
| Standard Deviation (Population) | 5.3% | 3.7% |
Similar Demographics by Male Poverty
Demographics Similar to Immigrants from Belize by Male Poverty
In terms of male poverty, the demographic groups most similar to Immigrants from Belize are Indonesian (13.8%, a difference of 0.010%), Hispanic or Latino (13.9%, a difference of 0.060%), Vietnamese (13.8%, a difference of 0.18%), Guatemalan (13.8%, a difference of 0.27%), and Immigrants from Zaire (13.8%, a difference of 0.27%).
| Demographics | Rating | Rank | Male Poverty |
| Shoshone | 0.0 /100 | #286 | Tragic 13.8% |
| Immigrants | Barbados | 0.0 /100 | #287 | Tragic 13.8% |
| Immigrants | St. Vincent and the Grenadines | 0.0 /100 | #288 | Tragic 13.8% |
| Guatemalans | 0.0 /100 | #289 | Tragic 13.8% |
| Immigrants | Zaire | 0.0 /100 | #290 | Tragic 13.8% |
| Vietnamese | 0.0 /100 | #291 | Tragic 13.8% |
| Indonesians | 0.0 /100 | #292 | Tragic 13.8% |
| Immigrants | Belize | 0.0 /100 | #293 | Tragic 13.8% |
| Hispanics or Latinos | 0.0 /100 | #294 | Tragic 13.9% |
| Immigrants | Central America | 0.0 /100 | #295 | Tragic 13.9% |
| Cajuns | 0.0 /100 | #296 | Tragic 13.9% |
| Inupiat | 0.0 /100 | #297 | Tragic 14.0% |
| Blackfeet | 0.0 /100 | #298 | Tragic 14.0% |
| Immigrants | Guatemala | 0.0 /100 | #299 | Tragic 14.0% |
| Immigrants | Mexico | 0.0 /100 | #300 | Tragic 14.0% |
Demographics Similar to Cubans by Male Poverty
In terms of male poverty, the demographic groups most similar to Cubans are Alsatian (12.4%, a difference of 0.090%), Alaska Native (12.4%, a difference of 0.13%), Nigerian (12.3%, a difference of 0.23%), Osage (12.3%, a difference of 0.39%), and Immigrants from Nigeria (12.3%, a difference of 0.45%).
| Demographics | Rating | Rank | Male Poverty |
| Immigrants | Africa | 2.1 /100 | #222 | Tragic 12.2% |
| Immigrants | Micronesia | 2.1 /100 | #223 | Tragic 12.2% |
| Immigrants | Nigeria | 1.6 /100 | #224 | Tragic 12.3% |
| Osage | 1.5 /100 | #225 | Tragic 12.3% |
| Nigerians | 1.4 /100 | #226 | Tragic 12.3% |
| Alaska Natives | 1.4 /100 | #227 | Tragic 12.4% |
| Alsatians | 1.3 /100 | #228 | Tragic 12.4% |
| Cubans | 1.3 /100 | #229 | Tragic 12.4% |
| Marshallese | 0.8 /100 | #230 | Tragic 12.5% |
| Salvadorans | 0.6 /100 | #231 | Tragic 12.6% |
| Nicaraguans | 0.6 /100 | #232 | Tragic 12.6% |
| Fijians | 0.6 /100 | #233 | Tragic 12.6% |
| Immigrants | Armenia | 0.6 /100 | #234 | Tragic 12.6% |
| Immigrants | Laos | 0.5 /100 | #235 | Tragic 12.6% |
| Immigrants | Saudi Arabia | 0.4 /100 | #236 | Tragic 12.7% |