Immigrants from Norway vs Alsatian Female Poverty Among 25-34 Year Olds
COMPARE
Immigrants from Norway
Alsatian
Female Poverty Among 25-34 Year Olds
Female Poverty Among 25-34 Year Olds Comparison
Immigrants from Norway
Alsatians
12.7%
FEMALE POVERTY AMONG 25-34 YEAR OLDS
94.4/ 100
METRIC RATING
108th/ 347
METRIC RANK
14.7%
FEMALE POVERTY AMONG 25-34 YEAR OLDS
1.4/ 100
METRIC RATING
238th/ 347
METRIC RANK
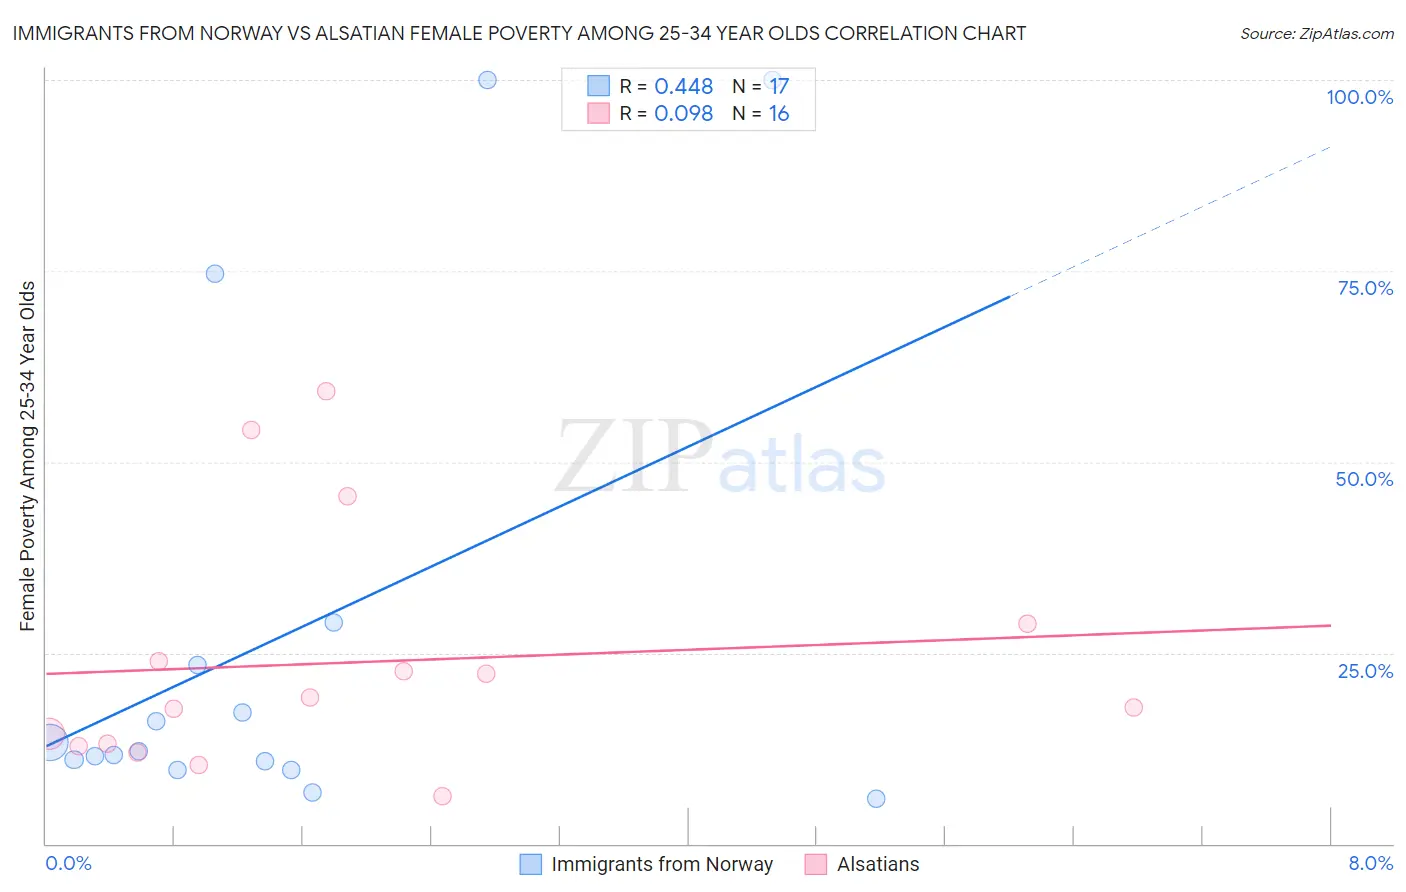
Immigrants from Norway vs Alsatian Female Poverty Among 25-34 Year Olds Correlation Chart
The statistical analysis conducted on geographies consisting of 115,750,676 people shows a moderate positive correlation between the proportion of Immigrants from Norway and poverty level among females between the ages 25 and 34 in the United States with a correlation coefficient (R) of 0.448 and weighted average of 12.7%. Similarly, the statistical analysis conducted on geographies consisting of 82,102,857 people shows a slight positive correlation between the proportion of Alsatians and poverty level among females between the ages 25 and 34 in the United States with a correlation coefficient (R) of 0.098 and weighted average of 14.7%, a difference of 15.7%.
Female Poverty Among 25-34 Year Olds Correlation Summary
| Measurement | Immigrants from Norway | Alsatian |
| Minimum | 5.8% | 6.2% |
| Maximum | 100.0% | 59.3% |
| Range | 94.2% | 53.1% |
| Mean | 27.2% | 23.7% |
| Median | 12.1% | 18.5% |
| Interquartile 25% (IQ1) | 10.2% | 12.9% |
| Interquartile 75% (IQ3) | 26.2% | 26.4% |
| Interquartile Range (IQR) | 16.0% | 13.4% |
| Standard Deviation (Sample) | 31.7% | 15.8% |
| Standard Deviation (Population) | 30.7% | 15.3% |
Similar Demographics by Female Poverty Among 25-34 Year Olds
Demographics Similar to Immigrants from Norway by Female Poverty Among 25-34 Year Olds
In terms of female poverty among 25-34 year olds, the demographic groups most similar to Immigrants from Norway are Immigrants from Peru (12.7%, a difference of 0.030%), Australian (12.8%, a difference of 0.11%), Danish (12.8%, a difference of 0.17%), Immigrants from Morocco (12.8%, a difference of 0.19%), and Immigrants from Syria (12.8%, a difference of 0.23%).
| Demographics | Rating | Rank | Female Poverty Among 25-34 Year Olds |
| Immigrants | Switzerland | 95.7 /100 | #101 | Exceptional 12.7% |
| Peruvians | 95.6 /100 | #102 | Exceptional 12.7% |
| Immigrants | Spain | 95.5 /100 | #103 | Exceptional 12.7% |
| Swedes | 95.4 /100 | #104 | Exceptional 12.7% |
| Immigrants | South Africa | 95.3 /100 | #105 | Exceptional 12.7% |
| Tsimshian | 95.1 /100 | #106 | Exceptional 12.7% |
| Poles | 94.9 /100 | #107 | Exceptional 12.7% |
| Immigrants | Norway | 94.4 /100 | #108 | Exceptional 12.7% |
| Immigrants | Peru | 94.3 /100 | #109 | Exceptional 12.7% |
| Australians | 94.1 /100 | #110 | Exceptional 12.8% |
| Danes | 93.9 /100 | #111 | Exceptional 12.8% |
| Immigrants | Morocco | 93.9 /100 | #112 | Exceptional 12.8% |
| Immigrants | Syria | 93.8 /100 | #113 | Exceptional 12.8% |
| Immigrants | Southern Europe | 93.6 /100 | #114 | Exceptional 12.8% |
| Immigrants | Brazil | 93.3 /100 | #115 | Exceptional 12.8% |
Demographics Similar to Alsatians by Female Poverty Among 25-34 Year Olds
In terms of female poverty among 25-34 year olds, the demographic groups most similar to Alsatians are Malaysian (14.7%, a difference of 0.030%), Salvadoran (14.7%, a difference of 0.040%), Immigrants from Ghana (14.7%, a difference of 0.040%), Immigrants from Jamaica (14.7%, a difference of 0.060%), and Immigrants from Grenada (14.7%, a difference of 0.080%).
| Demographics | Rating | Rank | Female Poverty Among 25-34 Year Olds |
| Delaware | 2.3 /100 | #231 | Tragic 14.6% |
| Immigrants | Ecuador | 1.9 /100 | #232 | Tragic 14.6% |
| Whites/Caucasians | 1.8 /100 | #233 | Tragic 14.7% |
| Cubans | 1.6 /100 | #234 | Tragic 14.7% |
| Immigrants | Jamaica | 1.4 /100 | #235 | Tragic 14.7% |
| Salvadorans | 1.4 /100 | #236 | Tragic 14.7% |
| Immigrants | Ghana | 1.4 /100 | #237 | Tragic 14.7% |
| Alsatians | 1.4 /100 | #238 | Tragic 14.7% |
| Malaysians | 1.4 /100 | #239 | Tragic 14.7% |
| Immigrants | Grenada | 1.3 /100 | #240 | Tragic 14.7% |
| Scotch-Irish | 1.2 /100 | #241 | Tragic 14.8% |
| Barbadians | 1.2 /100 | #242 | Tragic 14.8% |
| Immigrants | Nicaragua | 1.1 /100 | #243 | Tragic 14.8% |
| Immigrants | Bangladesh | 1.1 /100 | #244 | Tragic 14.8% |
| Immigrants | Middle Africa | 1.0 /100 | #245 | Tragic 14.8% |