Immigrants from Norway vs Moroccan Female Poverty Among 25-34 Year Olds
COMPARE
Immigrants from Norway
Moroccan
Female Poverty Among 25-34 Year Olds
Female Poverty Among 25-34 Year Olds Comparison
Immigrants from Norway
Moroccans
12.7%
FEMALE POVERTY AMONG 25-34 YEAR OLDS
94.4/ 100
METRIC RATING
108th/ 347
METRIC RANK
13.8%
FEMALE POVERTY AMONG 25-34 YEAR OLDS
25.1/ 100
METRIC RATING
194th/ 347
METRIC RANK
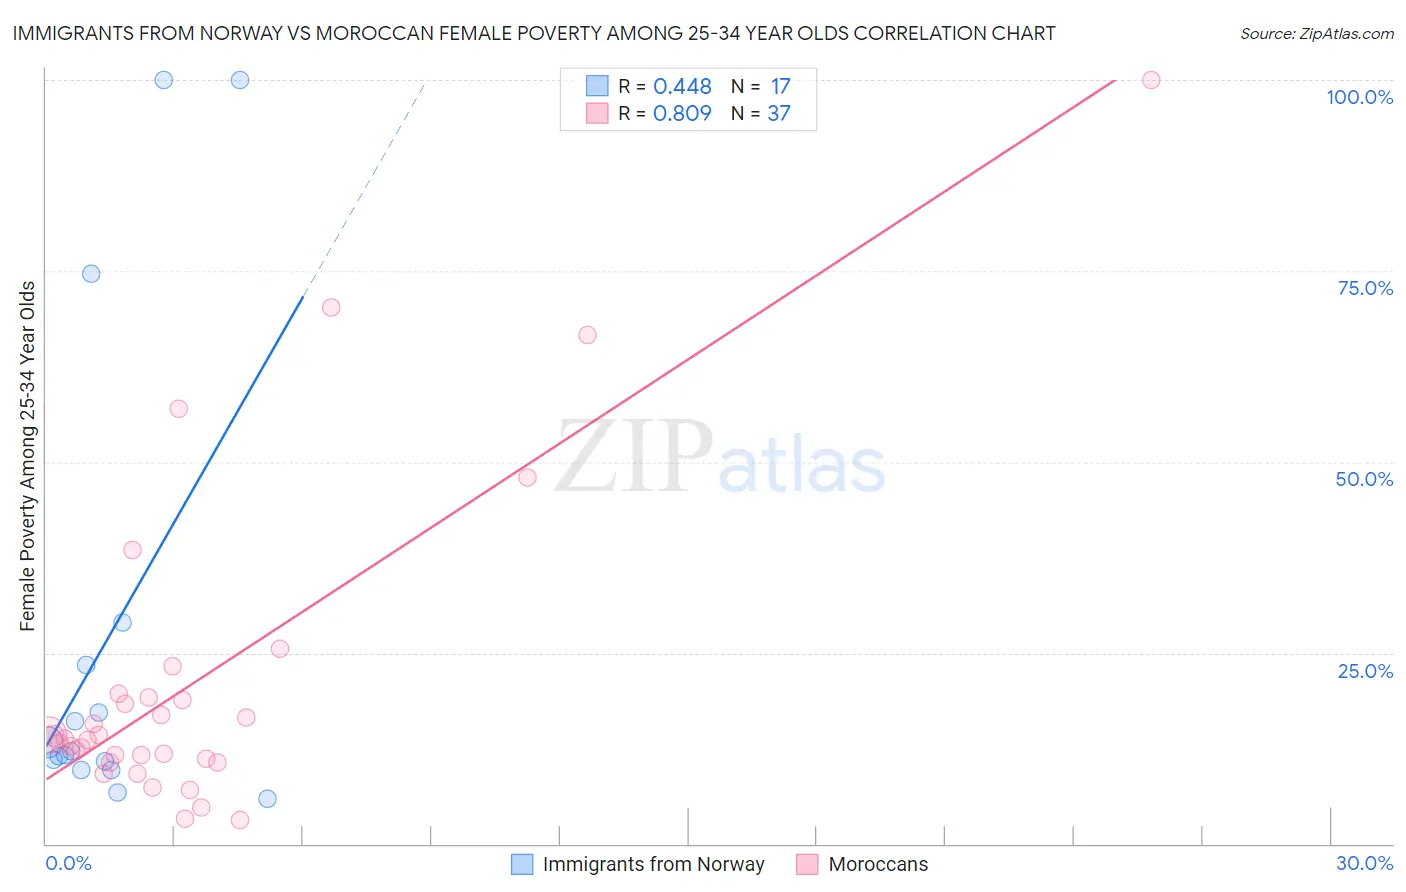
Immigrants from Norway vs Moroccan Female Poverty Among 25-34 Year Olds Correlation Chart
The statistical analysis conducted on geographies consisting of 115,750,676 people shows a moderate positive correlation between the proportion of Immigrants from Norway and poverty level among females between the ages 25 and 34 in the United States with a correlation coefficient (R) of 0.448 and weighted average of 12.7%. Similarly, the statistical analysis conducted on geographies consisting of 200,251,760 people shows a very strong positive correlation between the proportion of Moroccans and poverty level among females between the ages 25 and 34 in the United States with a correlation coefficient (R) of 0.809 and weighted average of 13.8%, a difference of 8.6%.
Female Poverty Among 25-34 Year Olds Correlation Summary
| Measurement | Immigrants from Norway | Moroccan |
| Minimum | 5.8% | 3.1% |
| Maximum | 100.0% | 100.0% |
| Range | 94.2% | 96.9% |
| Mean | 27.2% | 21.2% |
| Median | 12.1% | 13.8% |
| Interquartile 25% (IQ1) | 10.2% | 10.9% |
| Interquartile 75% (IQ3) | 26.2% | 19.4% |
| Interquartile Range (IQR) | 16.0% | 8.6% |
| Standard Deviation (Sample) | 31.7% | 21.0% |
| Standard Deviation (Population) | 30.7% | 20.7% |
Similar Demographics by Female Poverty Among 25-34 Year Olds
Demographics Similar to Immigrants from Norway by Female Poverty Among 25-34 Year Olds
In terms of female poverty among 25-34 year olds, the demographic groups most similar to Immigrants from Norway are Immigrants from Peru (12.7%, a difference of 0.030%), Australian (12.8%, a difference of 0.11%), Danish (12.8%, a difference of 0.17%), Immigrants from Morocco (12.8%, a difference of 0.19%), and Immigrants from Syria (12.8%, a difference of 0.23%).
| Demographics | Rating | Rank | Female Poverty Among 25-34 Year Olds |
| Immigrants | Switzerland | 95.7 /100 | #101 | Exceptional 12.7% |
| Peruvians | 95.6 /100 | #102 | Exceptional 12.7% |
| Immigrants | Spain | 95.5 /100 | #103 | Exceptional 12.7% |
| Swedes | 95.4 /100 | #104 | Exceptional 12.7% |
| Immigrants | South Africa | 95.3 /100 | #105 | Exceptional 12.7% |
| Tsimshian | 95.1 /100 | #106 | Exceptional 12.7% |
| Poles | 94.9 /100 | #107 | Exceptional 12.7% |
| Immigrants | Norway | 94.4 /100 | #108 | Exceptional 12.7% |
| Immigrants | Peru | 94.3 /100 | #109 | Exceptional 12.7% |
| Australians | 94.1 /100 | #110 | Exceptional 12.8% |
| Danes | 93.9 /100 | #111 | Exceptional 12.8% |
| Immigrants | Morocco | 93.9 /100 | #112 | Exceptional 12.8% |
| Immigrants | Syria | 93.8 /100 | #113 | Exceptional 12.8% |
| Immigrants | Southern Europe | 93.6 /100 | #114 | Exceptional 12.8% |
| Immigrants | Brazil | 93.3 /100 | #115 | Exceptional 12.8% |
Demographics Similar to Moroccans by Female Poverty Among 25-34 Year Olds
In terms of female poverty among 25-34 year olds, the demographic groups most similar to Moroccans are Immigrants from Cambodia (13.9%, a difference of 0.11%), Scottish (13.9%, a difference of 0.16%), Immigrants from Kenya (13.8%, a difference of 0.31%), Tlingit-Haida (13.8%, a difference of 0.32%), and Immigrants from Saudi Arabia (13.9%, a difference of 0.36%).
| Demographics | Rating | Rank | Female Poverty Among 25-34 Year Olds |
| Slovaks | 34.1 /100 | #187 | Fair 13.7% |
| Immigrants | Eritrea | 32.7 /100 | #188 | Fair 13.7% |
| Finns | 32.5 /100 | #189 | Fair 13.7% |
| Dutch | 29.7 /100 | #190 | Fair 13.8% |
| Immigrants | St. Vincent and the Grenadines | 29.3 /100 | #191 | Fair 13.8% |
| Tlingit-Haida | 28.1 /100 | #192 | Fair 13.8% |
| Immigrants | Kenya | 28.0 /100 | #193 | Fair 13.8% |
| Moroccans | 25.1 /100 | #194 | Fair 13.8% |
| Immigrants | Cambodia | 24.0 /100 | #195 | Fair 13.9% |
| Scottish | 23.6 /100 | #196 | Fair 13.9% |
| Immigrants | Saudi Arabia | 21.9 /100 | #197 | Fair 13.9% |
| Immigrants | Germany | 20.9 /100 | #198 | Fair 13.9% |
| English | 20.4 /100 | #199 | Fair 13.9% |
| Hmong | 20.3 /100 | #200 | Fair 13.9% |
| Immigrants | Trinidad and Tobago | 17.6 /100 | #201 | Poor 14.0% |