Immigrants from Norway vs Immigrants from Egypt Female Poverty Among 25-34 Year Olds
COMPARE
Immigrants from Norway
Immigrants from Egypt
Female Poverty Among 25-34 Year Olds
Female Poverty Among 25-34 Year Olds Comparison
Immigrants from Norway
Immigrants from Egypt
12.7%
FEMALE POVERTY AMONG 25-34 YEAR OLDS
94.4/ 100
METRIC RATING
108th/ 347
METRIC RANK
12.0%
FEMALE POVERTY AMONG 25-34 YEAR OLDS
99.6/ 100
METRIC RATING
49th/ 347
METRIC RANK
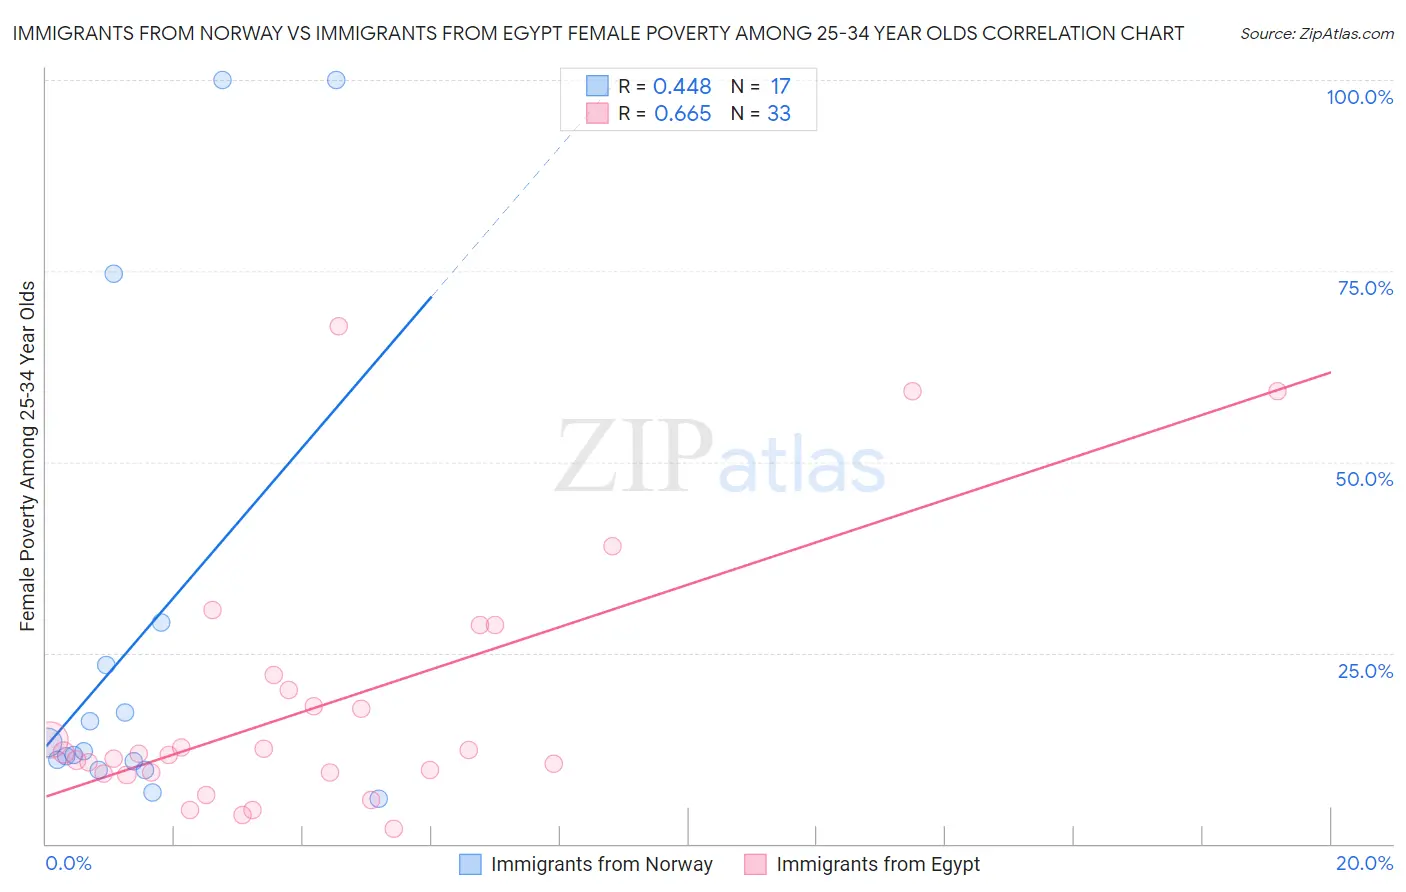
Immigrants from Norway vs Immigrants from Egypt Female Poverty Among 25-34 Year Olds Correlation Chart
The statistical analysis conducted on geographies consisting of 115,750,676 people shows a moderate positive correlation between the proportion of Immigrants from Norway and poverty level among females between the ages 25 and 34 in the United States with a correlation coefficient (R) of 0.448 and weighted average of 12.7%. Similarly, the statistical analysis conducted on geographies consisting of 242,883,921 people shows a significant positive correlation between the proportion of Immigrants from Egypt and poverty level among females between the ages 25 and 34 in the United States with a correlation coefficient (R) of 0.665 and weighted average of 12.0%, a difference of 6.4%.
Female Poverty Among 25-34 Year Olds Correlation Summary
| Measurement | Immigrants from Norway | Immigrants from Egypt |
| Minimum | 5.8% | 2.0% |
| Maximum | 100.0% | 67.8% |
| Range | 94.2% | 65.8% |
| Mean | 27.2% | 18.0% |
| Median | 12.1% | 11.8% |
| Interquartile 25% (IQ1) | 10.2% | 9.2% |
| Interquartile 75% (IQ3) | 26.2% | 21.2% |
| Interquartile Range (IQR) | 16.0% | 11.9% |
| Standard Deviation (Sample) | 31.7% | 16.5% |
| Standard Deviation (Population) | 30.7% | 16.2% |
Similar Demographics by Female Poverty Among 25-34 Year Olds
Demographics Similar to Immigrants from Norway by Female Poverty Among 25-34 Year Olds
In terms of female poverty among 25-34 year olds, the demographic groups most similar to Immigrants from Norway are Immigrants from Peru (12.7%, a difference of 0.030%), Australian (12.8%, a difference of 0.11%), Danish (12.8%, a difference of 0.17%), Immigrants from Morocco (12.8%, a difference of 0.19%), and Immigrants from Syria (12.8%, a difference of 0.23%).
| Demographics | Rating | Rank | Female Poverty Among 25-34 Year Olds |
| Immigrants | Switzerland | 95.7 /100 | #101 | Exceptional 12.7% |
| Peruvians | 95.6 /100 | #102 | Exceptional 12.7% |
| Immigrants | Spain | 95.5 /100 | #103 | Exceptional 12.7% |
| Swedes | 95.4 /100 | #104 | Exceptional 12.7% |
| Immigrants | South Africa | 95.3 /100 | #105 | Exceptional 12.7% |
| Tsimshian | 95.1 /100 | #106 | Exceptional 12.7% |
| Poles | 94.9 /100 | #107 | Exceptional 12.7% |
| Immigrants | Norway | 94.4 /100 | #108 | Exceptional 12.7% |
| Immigrants | Peru | 94.3 /100 | #109 | Exceptional 12.7% |
| Australians | 94.1 /100 | #110 | Exceptional 12.8% |
| Danes | 93.9 /100 | #111 | Exceptional 12.8% |
| Immigrants | Morocco | 93.9 /100 | #112 | Exceptional 12.8% |
| Immigrants | Syria | 93.8 /100 | #113 | Exceptional 12.8% |
| Immigrants | Southern Europe | 93.6 /100 | #114 | Exceptional 12.8% |
| Immigrants | Brazil | 93.3 /100 | #115 | Exceptional 12.8% |
Demographics Similar to Immigrants from Egypt by Female Poverty Among 25-34 Year Olds
In terms of female poverty among 25-34 year olds, the demographic groups most similar to Immigrants from Egypt are Immigrants from Croatia (12.0%, a difference of 0.020%), Paraguayan (12.0%, a difference of 0.020%), Immigrants from Eastern Europe (12.0%, a difference of 0.040%), Immigrants from Belarus (12.0%, a difference of 0.080%), and Korean (12.0%, a difference of 0.13%).
| Demographics | Rating | Rank | Female Poverty Among 25-34 Year Olds |
| Immigrants | Turkey | 99.7 /100 | #42 | Exceptional 11.9% |
| Egyptians | 99.7 /100 | #43 | Exceptional 11.9% |
| Immigrants | Australia | 99.7 /100 | #44 | Exceptional 11.9% |
| Macedonians | 99.7 /100 | #45 | Exceptional 11.9% |
| Immigrants | Serbia | 99.7 /100 | #46 | Exceptional 11.9% |
| Koreans | 99.6 /100 | #47 | Exceptional 12.0% |
| Immigrants | Belarus | 99.6 /100 | #48 | Exceptional 12.0% |
| Immigrants | Egypt | 99.6 /100 | #49 | Exceptional 12.0% |
| Immigrants | Croatia | 99.6 /100 | #50 | Exceptional 12.0% |
| Paraguayans | 99.6 /100 | #51 | Exceptional 12.0% |
| Immigrants | Eastern Europe | 99.6 /100 | #52 | Exceptional 12.0% |
| Immigrants | Israel | 99.6 /100 | #53 | Exceptional 12.0% |
| Eastern Europeans | 99.6 /100 | #54 | Exceptional 12.0% |
| Immigrants | Philippines | 99.5 /100 | #55 | Exceptional 12.0% |
| Luxembourgers | 99.5 /100 | #56 | Exceptional 12.1% |