Immigrants from Zimbabwe vs Alsatian Female Poverty Among 25-34 Year Olds
COMPARE
Immigrants from Zimbabwe
Alsatian
Female Poverty Among 25-34 Year Olds
Female Poverty Among 25-34 Year Olds Comparison
Immigrants from Zimbabwe
Alsatians
12.6%
FEMALE POVERTY AMONG 25-34 YEAR OLDS
96.7/ 100
METRIC RATING
96th/ 347
METRIC RANK
14.7%
FEMALE POVERTY AMONG 25-34 YEAR OLDS
1.4/ 100
METRIC RATING
238th/ 347
METRIC RANK
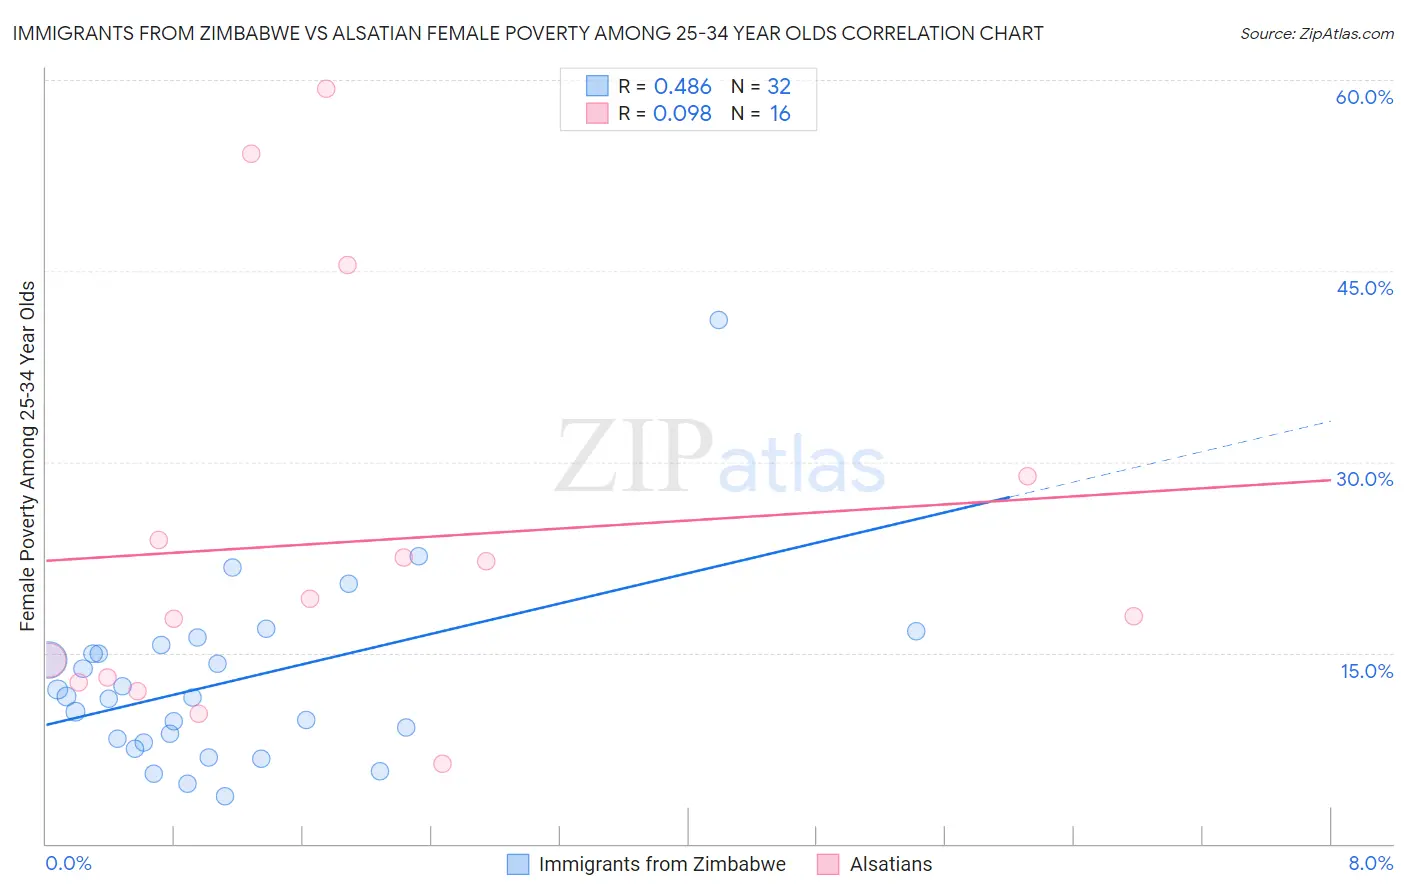
Immigrants from Zimbabwe vs Alsatian Female Poverty Among 25-34 Year Olds Correlation Chart
The statistical analysis conducted on geographies consisting of 117,339,985 people shows a moderate positive correlation between the proportion of Immigrants from Zimbabwe and poverty level among females between the ages 25 and 34 in the United States with a correlation coefficient (R) of 0.486 and weighted average of 12.6%. Similarly, the statistical analysis conducted on geographies consisting of 82,102,857 people shows a slight positive correlation between the proportion of Alsatians and poverty level among females between the ages 25 and 34 in the United States with a correlation coefficient (R) of 0.098 and weighted average of 14.7%, a difference of 17.1%.
Female Poverty Among 25-34 Year Olds Correlation Summary
| Measurement | Immigrants from Zimbabwe | Alsatian |
| Minimum | 3.8% | 6.2% |
| Maximum | 41.1% | 59.3% |
| Range | 37.4% | 53.1% |
| Mean | 12.7% | 23.7% |
| Median | 11.5% | 18.5% |
| Interquartile 25% (IQ1) | 8.1% | 12.9% |
| Interquartile 75% (IQ3) | 15.3% | 26.4% |
| Interquartile Range (IQR) | 7.2% | 13.4% |
| Standard Deviation (Sample) | 7.1% | 15.8% |
| Standard Deviation (Population) | 7.0% | 15.3% |
Similar Demographics by Female Poverty Among 25-34 Year Olds
Demographics Similar to Immigrants from Zimbabwe by Female Poverty Among 25-34 Year Olds
In terms of female poverty among 25-34 year olds, the demographic groups most similar to Immigrants from Zimbabwe are Ukrainian (12.6%, a difference of 0.010%), Immigrants from France (12.6%, a difference of 0.050%), Palestinian (12.6%, a difference of 0.10%), Immigrants from Northern Africa (12.6%, a difference of 0.12%), and Immigrants from Ethiopia (12.6%, a difference of 0.12%).
| Demographics | Rating | Rank | Female Poverty Among 25-34 Year Olds |
| Italians | 97.2 /100 | #89 | Exceptional 12.5% |
| Immigrants | Albania | 97.1 /100 | #90 | Exceptional 12.5% |
| Norwegians | 96.9 /100 | #91 | Exceptional 12.6% |
| Immigrants | Armenia | 96.9 /100 | #92 | Exceptional 12.6% |
| Palestinians | 96.9 /100 | #93 | Exceptional 12.6% |
| Immigrants | France | 96.8 /100 | #94 | Exceptional 12.6% |
| Ukrainians | 96.7 /100 | #95 | Exceptional 12.6% |
| Immigrants | Zimbabwe | 96.7 /100 | #96 | Exceptional 12.6% |
| Immigrants | Northern Africa | 96.6 /100 | #97 | Exceptional 12.6% |
| Immigrants | Ethiopia | 96.5 /100 | #98 | Exceptional 12.6% |
| Immigrants | Argentina | 96.4 /100 | #99 | Exceptional 12.6% |
| Immigrants | Denmark | 95.7 /100 | #100 | Exceptional 12.7% |
| Immigrants | Switzerland | 95.7 /100 | #101 | Exceptional 12.7% |
| Peruvians | 95.6 /100 | #102 | Exceptional 12.7% |
| Immigrants | Spain | 95.5 /100 | #103 | Exceptional 12.7% |
Demographics Similar to Alsatians by Female Poverty Among 25-34 Year Olds
In terms of female poverty among 25-34 year olds, the demographic groups most similar to Alsatians are Malaysian (14.7%, a difference of 0.030%), Salvadoran (14.7%, a difference of 0.040%), Immigrants from Ghana (14.7%, a difference of 0.040%), Immigrants from Jamaica (14.7%, a difference of 0.060%), and Immigrants from Grenada (14.7%, a difference of 0.080%).
| Demographics | Rating | Rank | Female Poverty Among 25-34 Year Olds |
| Delaware | 2.3 /100 | #231 | Tragic 14.6% |
| Immigrants | Ecuador | 1.9 /100 | #232 | Tragic 14.6% |
| Whites/Caucasians | 1.8 /100 | #233 | Tragic 14.7% |
| Cubans | 1.6 /100 | #234 | Tragic 14.7% |
| Immigrants | Jamaica | 1.4 /100 | #235 | Tragic 14.7% |
| Salvadorans | 1.4 /100 | #236 | Tragic 14.7% |
| Immigrants | Ghana | 1.4 /100 | #237 | Tragic 14.7% |
| Alsatians | 1.4 /100 | #238 | Tragic 14.7% |
| Malaysians | 1.4 /100 | #239 | Tragic 14.7% |
| Immigrants | Grenada | 1.3 /100 | #240 | Tragic 14.7% |
| Scotch-Irish | 1.2 /100 | #241 | Tragic 14.8% |
| Barbadians | 1.2 /100 | #242 | Tragic 14.8% |
| Immigrants | Nicaragua | 1.1 /100 | #243 | Tragic 14.8% |
| Immigrants | Bangladesh | 1.1 /100 | #244 | Tragic 14.8% |
| Immigrants | Middle Africa | 1.0 /100 | #245 | Tragic 14.8% |