Immigrants from Northern Africa vs French Canadian Receiving Food Stamps
COMPARE
Immigrants from Northern Africa
French Canadian
Receiving Food Stamps
Receiving Food Stamps Comparison
Immigrants from Northern Africa
French Canadians
11.0%
RECEIVING FOOD STAMPS
86.0/ 100
METRIC RATING
143rd/ 347
METRIC RANK
11.4%
RECEIVING FOOD STAMPS
69.5/ 100
METRIC RATING
160th/ 347
METRIC RANK
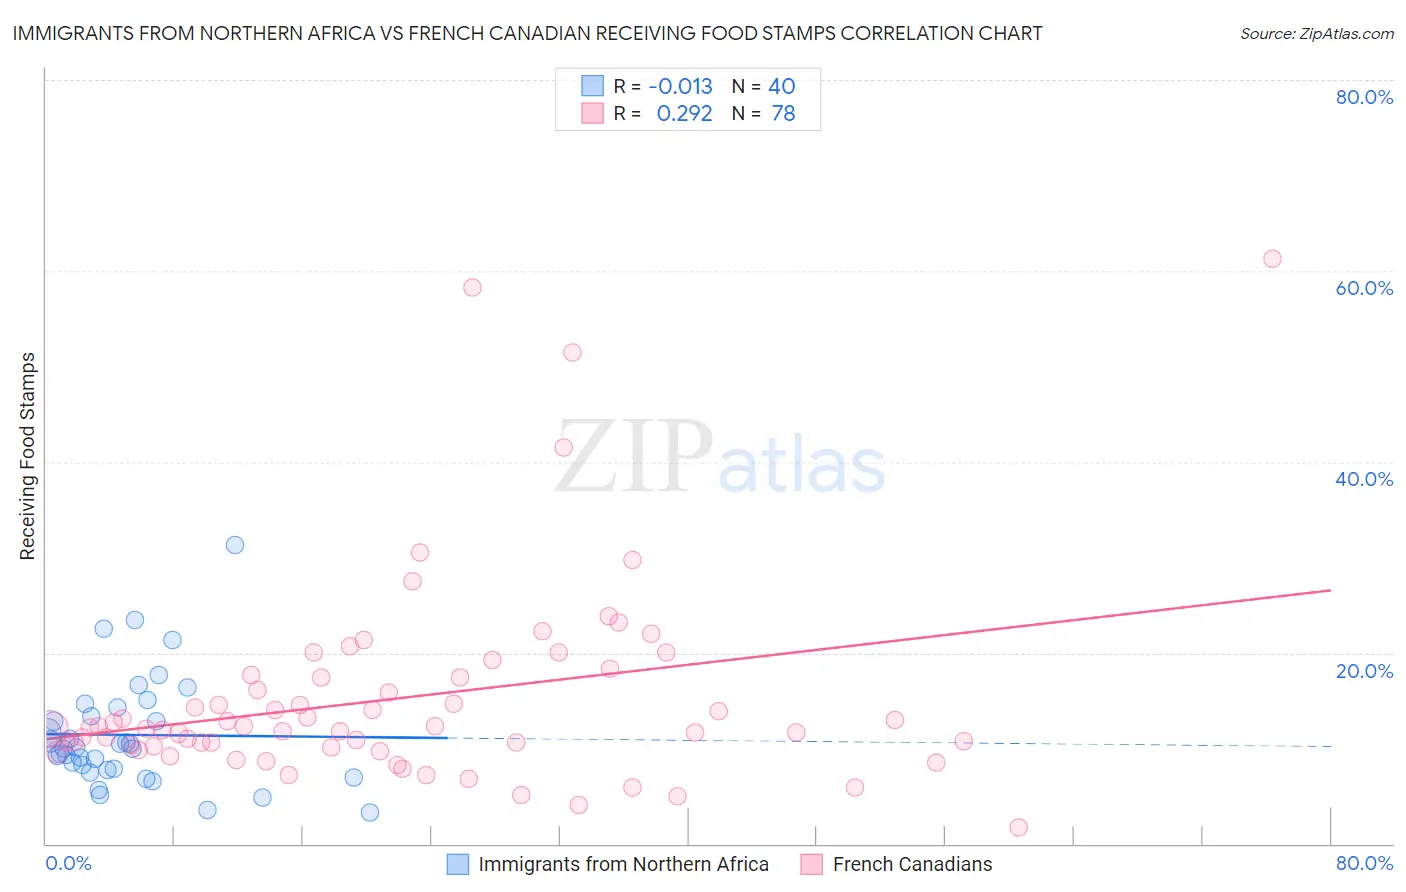
Immigrants from Northern Africa vs French Canadian Receiving Food Stamps Correlation Chart
The statistical analysis conducted on geographies consisting of 320,586,734 people shows no correlation between the proportion of Immigrants from Northern Africa and percentage of population receiving government assistance and/or food stamps in the United States with a correlation coefficient (R) of -0.013 and weighted average of 11.0%. Similarly, the statistical analysis conducted on geographies consisting of 500,490,947 people shows a weak positive correlation between the proportion of French Canadians and percentage of population receiving government assistance and/or food stamps in the United States with a correlation coefficient (R) of 0.292 and weighted average of 11.4%, a difference of 3.7%.
Receiving Food Stamps Correlation Summary
| Measurement | Immigrants from Northern Africa | French Canadian |
| Minimum | 3.3% | 1.7% |
| Maximum | 31.3% | 61.3% |
| Range | 28.0% | 59.6% |
| Mean | 11.4% | 15.3% |
| Median | 10.1% | 12.1% |
| Interquartile 25% (IQ1) | 7.8% | 10.2% |
| Interquartile 75% (IQ3) | 13.9% | 17.4% |
| Interquartile Range (IQR) | 6.1% | 7.3% |
| Standard Deviation (Sample) | 5.8% | 10.6% |
| Standard Deviation (Population) | 5.7% | 10.5% |
Demographics Similar to Immigrants from Northern Africa and French Canadians by Receiving Food Stamps
In terms of receiving food stamps, the demographic groups most similar to Immigrants from Northern Africa are Chilean (11.0%, a difference of 0.080%), Syrian (11.0%, a difference of 0.15%), Immigrants from Vietnam (11.0%, a difference of 0.25%), Hungarian (11.0%, a difference of 0.27%), and Taiwanese (11.0%, a difference of 0.51%). Similarly, the demographic groups most similar to French Canadians are Immigrants from Oceania (11.4%, a difference of 0.16%), Pennsylvania German (11.4%, a difference of 0.18%), Immigrants from Bosnia and Herzegovina (11.3%, a difference of 0.55%), Immigrants from Lebanon (11.3%, a difference of 1.0%), and Immigrants from Afghanistan (11.3%, a difference of 1.1%).
| Demographics | Rating | Rank | Receiving Food Stamps |
| Immigrants | Vietnam | 86.7 /100 | #141 | Excellent 11.0% |
| Chileans | 86.2 /100 | #142 | Excellent 11.0% |
| Immigrants | Northern Africa | 86.0 /100 | #143 | Excellent 11.0% |
| Syrians | 85.5 /100 | #144 | Excellent 11.0% |
| Hungarians | 85.1 /100 | #145 | Excellent 11.0% |
| Taiwanese | 84.2 /100 | #146 | Excellent 11.0% |
| Whites/Caucasians | 83.9 /100 | #147 | Excellent 11.1% |
| Immigrants | South Eastern Asia | 83.3 /100 | #148 | Excellent 11.1% |
| Brazilians | 83.2 /100 | #149 | Excellent 11.1% |
| Soviet Union | 83.1 /100 | #150 | Excellent 11.1% |
| Immigrants | Spain | 81.7 /100 | #151 | Excellent 11.1% |
| Immigrants | Kazakhstan | 81.7 /100 | #152 | Excellent 11.1% |
| Lebanese | 81.6 /100 | #153 | Excellent 11.1% |
| Armenians | 81.4 /100 | #154 | Excellent 11.1% |
| Immigrants | Argentina | 80.4 /100 | #155 | Excellent 11.2% |
| Immigrants | Afghanistan | 75.6 /100 | #156 | Good 11.3% |
| Immigrants | Lebanon | 75.2 /100 | #157 | Good 11.3% |
| Immigrants | Bosnia and Herzegovina | 72.6 /100 | #158 | Good 11.3% |
| Immigrants | Oceania | 70.4 /100 | #159 | Good 11.4% |
| French Canadians | 69.5 /100 | #160 | Good 11.4% |
| Pennsylvania Germans | 68.4 /100 | #161 | Good 11.4% |