Immigrants from Nepal vs French Canadian Receiving Food Stamps
COMPARE
Immigrants from Nepal
French Canadian
Receiving Food Stamps
Receiving Food Stamps Comparison
Immigrants from Nepal
French Canadians
10.6%
RECEIVING FOOD STAMPS
94.6/ 100
METRIC RATING
117th/ 347
METRIC RANK
11.4%
RECEIVING FOOD STAMPS
69.5/ 100
METRIC RATING
160th/ 347
METRIC RANK
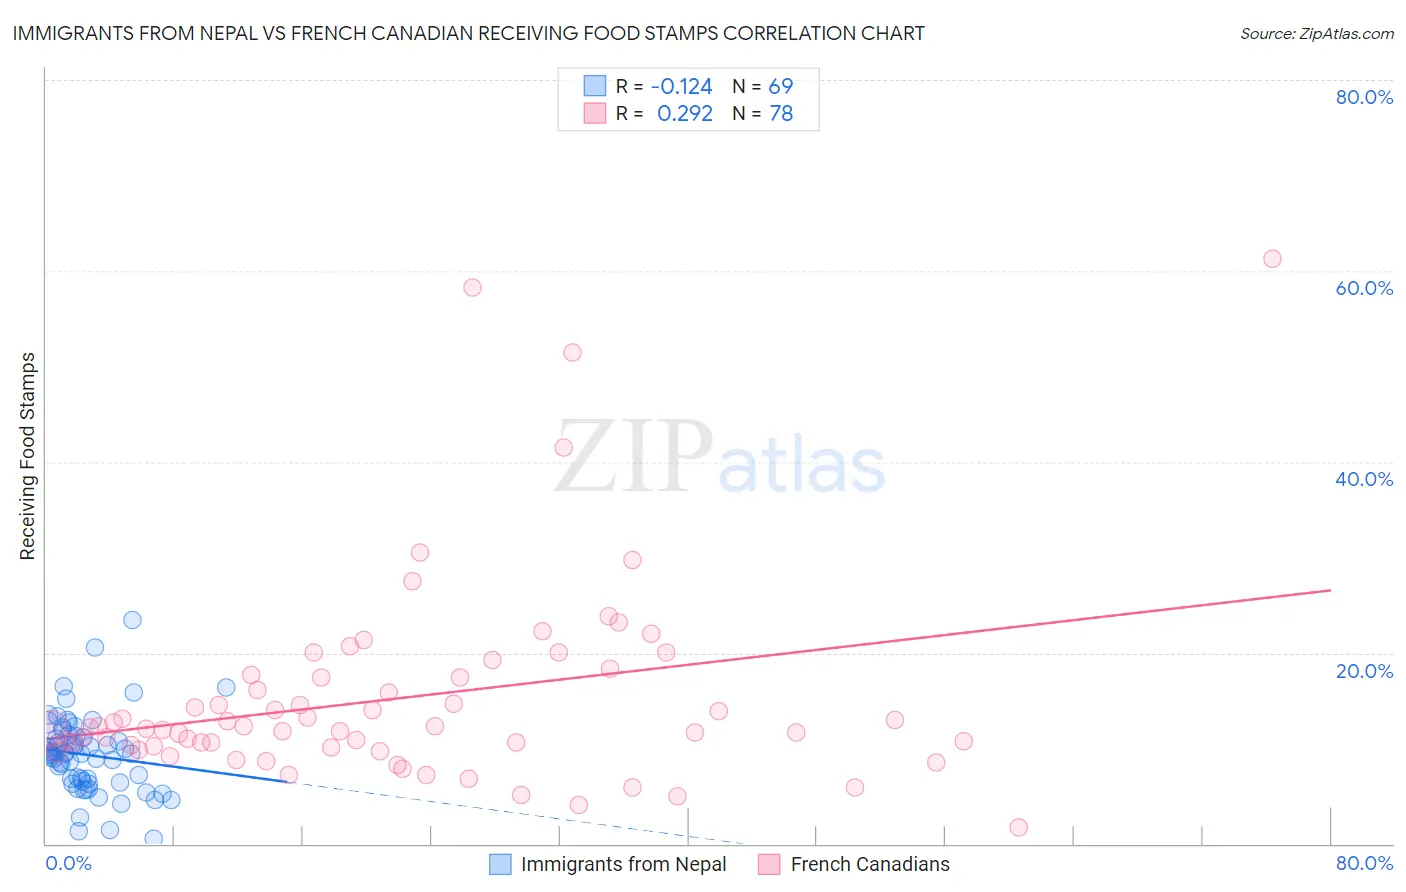
Immigrants from Nepal vs French Canadian Receiving Food Stamps Correlation Chart
The statistical analysis conducted on geographies consisting of 186,476,550 people shows a poor negative correlation between the proportion of Immigrants from Nepal and percentage of population receiving government assistance and/or food stamps in the United States with a correlation coefficient (R) of -0.124 and weighted average of 10.6%. Similarly, the statistical analysis conducted on geographies consisting of 500,490,947 people shows a weak positive correlation between the proportion of French Canadians and percentage of population receiving government assistance and/or food stamps in the United States with a correlation coefficient (R) of 0.292 and weighted average of 11.4%, a difference of 7.9%.
Receiving Food Stamps Correlation Summary
| Measurement | Immigrants from Nepal | French Canadian |
| Minimum | 0.50% | 1.7% |
| Maximum | 23.5% | 61.3% |
| Range | 23.0% | 59.6% |
| Mean | 9.3% | 15.3% |
| Median | 9.4% | 12.1% |
| Interquartile 25% (IQ1) | 6.5% | 10.2% |
| Interquartile 75% (IQ3) | 11.2% | 17.4% |
| Interquartile Range (IQR) | 4.7% | 7.3% |
| Standard Deviation (Sample) | 4.1% | 10.6% |
| Standard Deviation (Population) | 4.0% | 10.5% |
Similar Demographics by Receiving Food Stamps
Demographics Similar to Immigrants from Nepal by Receiving Food Stamps
In terms of receiving food stamps, the demographic groups most similar to Immigrants from Nepal are Canadian (10.5%, a difference of 0.16%), Immigrants from Saudi Arabia (10.5%, a difference of 0.21%), Assyrian/Chaldean/Syriac (10.6%, a difference of 0.34%), Scotch-Irish (10.5%, a difference of 0.39%), and Immigrants from Poland (10.6%, a difference of 0.50%).
| Demographics | Rating | Rank | Receiving Food Stamps |
| Pakistanis | 95.9 /100 | #110 | Exceptional 10.4% |
| Romanians | 95.8 /100 | #111 | Exceptional 10.4% |
| Mongolians | 95.8 /100 | #112 | Exceptional 10.5% |
| Icelanders | 95.4 /100 | #113 | Exceptional 10.5% |
| Scotch-Irish | 95.1 /100 | #114 | Exceptional 10.5% |
| Immigrants | Saudi Arabia | 94.9 /100 | #115 | Exceptional 10.5% |
| Canadians | 94.8 /100 | #116 | Exceptional 10.5% |
| Immigrants | Nepal | 94.6 /100 | #117 | Exceptional 10.6% |
| Assyrians/Chaldeans/Syriacs | 94.1 /100 | #118 | Exceptional 10.6% |
| Immigrants | Poland | 93.9 /100 | #119 | Exceptional 10.6% |
| Ethiopians | 93.9 /100 | #120 | Exceptional 10.6% |
| Slavs | 93.8 /100 | #121 | Exceptional 10.6% |
| Sri Lankans | 93.7 /100 | #122 | Exceptional 10.6% |
| Immigrants | Philippines | 93.3 /100 | #123 | Exceptional 10.7% |
| Paraguayans | 93.0 /100 | #124 | Exceptional 10.7% |
Demographics Similar to French Canadians by Receiving Food Stamps
In terms of receiving food stamps, the demographic groups most similar to French Canadians are Immigrants from Oceania (11.4%, a difference of 0.16%), Pennsylvania German (11.4%, a difference of 0.18%), Alsatian (11.4%, a difference of 0.25%), Immigrants from Bosnia and Herzegovina (11.3%, a difference of 0.55%), and Immigrants from Southern Europe (11.5%, a difference of 0.61%).
| Demographics | Rating | Rank | Receiving Food Stamps |
| Lebanese | 81.6 /100 | #153 | Excellent 11.1% |
| Armenians | 81.4 /100 | #154 | Excellent 11.1% |
| Immigrants | Argentina | 80.4 /100 | #155 | Excellent 11.2% |
| Immigrants | Afghanistan | 75.6 /100 | #156 | Good 11.3% |
| Immigrants | Lebanon | 75.2 /100 | #157 | Good 11.3% |
| Immigrants | Bosnia and Herzegovina | 72.6 /100 | #158 | Good 11.3% |
| Immigrants | Oceania | 70.4 /100 | #159 | Good 11.4% |
| French Canadians | 69.5 /100 | #160 | Good 11.4% |
| Pennsylvania Germans | 68.4 /100 | #161 | Good 11.4% |
| Alsatians | 68.0 /100 | #162 | Good 11.4% |
| Immigrants | Southern Europe | 65.8 /100 | #163 | Good 11.5% |
| Immigrants | Chile | 65.0 /100 | #164 | Good 11.5% |
| Arabs | 64.7 /100 | #165 | Good 11.5% |
| Immigrants | Belarus | 62.8 /100 | #166 | Good 11.5% |
| Kenyans | 60.2 /100 | #167 | Good 11.6% |