Immigrants from Northern Africa vs French Canadian Single Mother Households
COMPARE
Immigrants from Northern Africa
French Canadian
Single Mother Households
Single Mother Households Comparison
Immigrants from Northern Africa
French Canadians
6.2%
SINGLE MOTHER HOUSEHOLDS
68.0/ 100
METRIC RATING
164th/ 347
METRIC RANK
6.0%
SINGLE MOTHER HOUSEHOLDS
82.6/ 100
METRIC RATING
146th/ 347
METRIC RANK
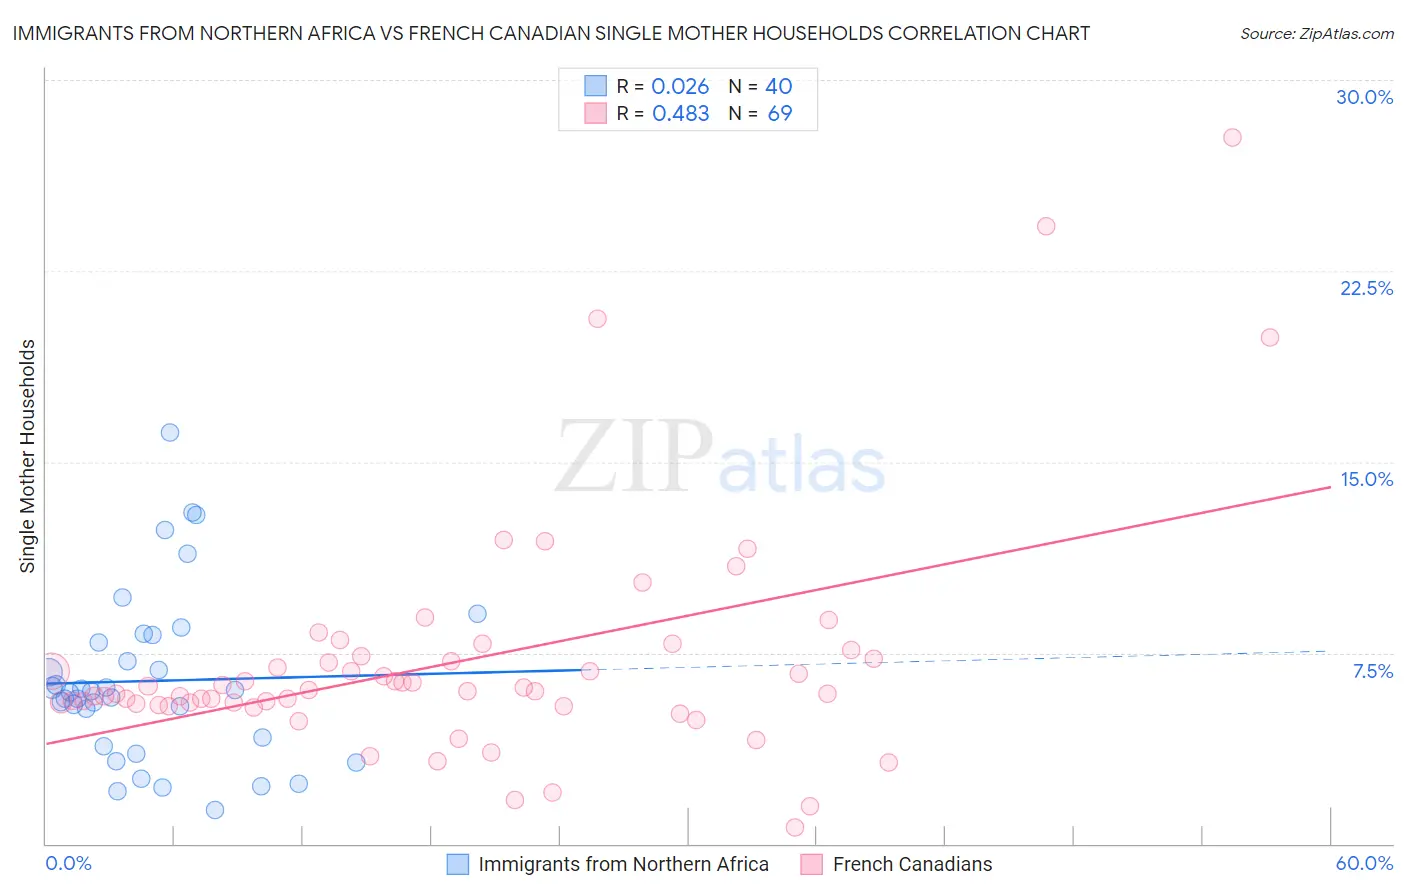
Immigrants from Northern Africa vs French Canadian Single Mother Households Correlation Chart
The statistical analysis conducted on geographies consisting of 320,525,361 people shows no correlation between the proportion of Immigrants from Northern Africa and percentage of single mother households in the United States with a correlation coefficient (R) of 0.026 and weighted average of 6.2%. Similarly, the statistical analysis conducted on geographies consisting of 499,765,796 people shows a moderate positive correlation between the proportion of French Canadians and percentage of single mother households in the United States with a correlation coefficient (R) of 0.483 and weighted average of 6.0%, a difference of 2.3%.
Single Mother Households Correlation Summary
| Measurement | Immigrants from Northern Africa | French Canadian |
| Minimum | 1.3% | 0.62% |
| Maximum | 16.1% | 27.8% |
| Range | 14.8% | 27.1% |
| Mean | 6.4% | 7.1% |
| Median | 6.0% | 6.0% |
| Interquartile 25% (IQ1) | 4.0% | 5.5% |
| Interquartile 75% (IQ3) | 8.0% | 7.3% |
| Interquartile Range (IQR) | 4.0% | 1.8% |
| Standard Deviation (Sample) | 3.3% | 4.6% |
| Standard Deviation (Population) | 3.3% | 4.6% |
Demographics Similar to Immigrants from Northern Africa and French Canadians by Single Mother Households
In terms of single mother households, the demographic groups most similar to Immigrants from Northern Africa are Immigrants from Syria (6.2%, a difference of 0.070%), Alsatian (6.2%, a difference of 0.090%), Immigrants from Zimbabwe (6.2%, a difference of 0.25%), Immigrants from Germany (6.1%, a difference of 0.60%), and Iraqi (6.1%, a difference of 0.68%). Similarly, the demographic groups most similar to French Canadians are Immigrants from Jordan (6.0%, a difference of 0.060%), Scotch-Irish (6.0%, a difference of 0.11%), Immigrants from Albania (6.1%, a difference of 0.21%), Arab (6.0%, a difference of 0.29%), and Zimbabwean (6.1%, a difference of 0.35%).
| Demographics | Rating | Rank | Single Mother Households |
| Arabs | 84.0 /100 | #145 | Excellent 6.0% |
| French Canadians | 82.6 /100 | #146 | Excellent 6.0% |
| Immigrants | Jordan | 82.3 /100 | #147 | Excellent 6.0% |
| Scotch-Irish | 82.0 /100 | #148 | Excellent 6.0% |
| Immigrants | Albania | 81.5 /100 | #149 | Excellent 6.1% |
| Zimbabweans | 80.7 /100 | #150 | Excellent 6.1% |
| Immigrants | Southern Europe | 80.5 /100 | #151 | Excellent 6.1% |
| Pakistanis | 79.2 /100 | #152 | Good 6.1% |
| Immigrants | Brazil | 78.9 /100 | #153 | Good 6.1% |
| Immigrants | Philippines | 78.5 /100 | #154 | Good 6.1% |
| Whites/Caucasians | 76.5 /100 | #155 | Good 6.1% |
| Native Hawaiians | 75.0 /100 | #156 | Good 6.1% |
| Chileans | 74.2 /100 | #157 | Good 6.1% |
| Celtics | 73.3 /100 | #158 | Good 6.1% |
| Yugoslavians | 73.1 /100 | #159 | Good 6.1% |
| Iraqis | 73.0 /100 | #160 | Good 6.1% |
| Immigrants | Germany | 72.4 /100 | #161 | Good 6.1% |
| Immigrants | Zimbabwe | 69.9 /100 | #162 | Good 6.2% |
| Alsatians | 68.7 /100 | #163 | Good 6.2% |
| Immigrants | Northern Africa | 68.0 /100 | #164 | Good 6.2% |
| Immigrants | Syria | 67.4 /100 | #165 | Good 6.2% |