Immigrants from Northern Africa vs French Canadian Ambulatory Disability
COMPARE
Immigrants from Northern Africa
French Canadian
Ambulatory Disability
Ambulatory Disability Comparison
Immigrants from Northern Africa
French Canadians
5.7%
AMBULATORY DISABILITY
99.4/ 100
METRIC RATING
73rd/ 347
METRIC RANK
6.7%
AMBULATORY DISABILITY
0.1/ 100
METRIC RATING
272nd/ 347
METRIC RANK
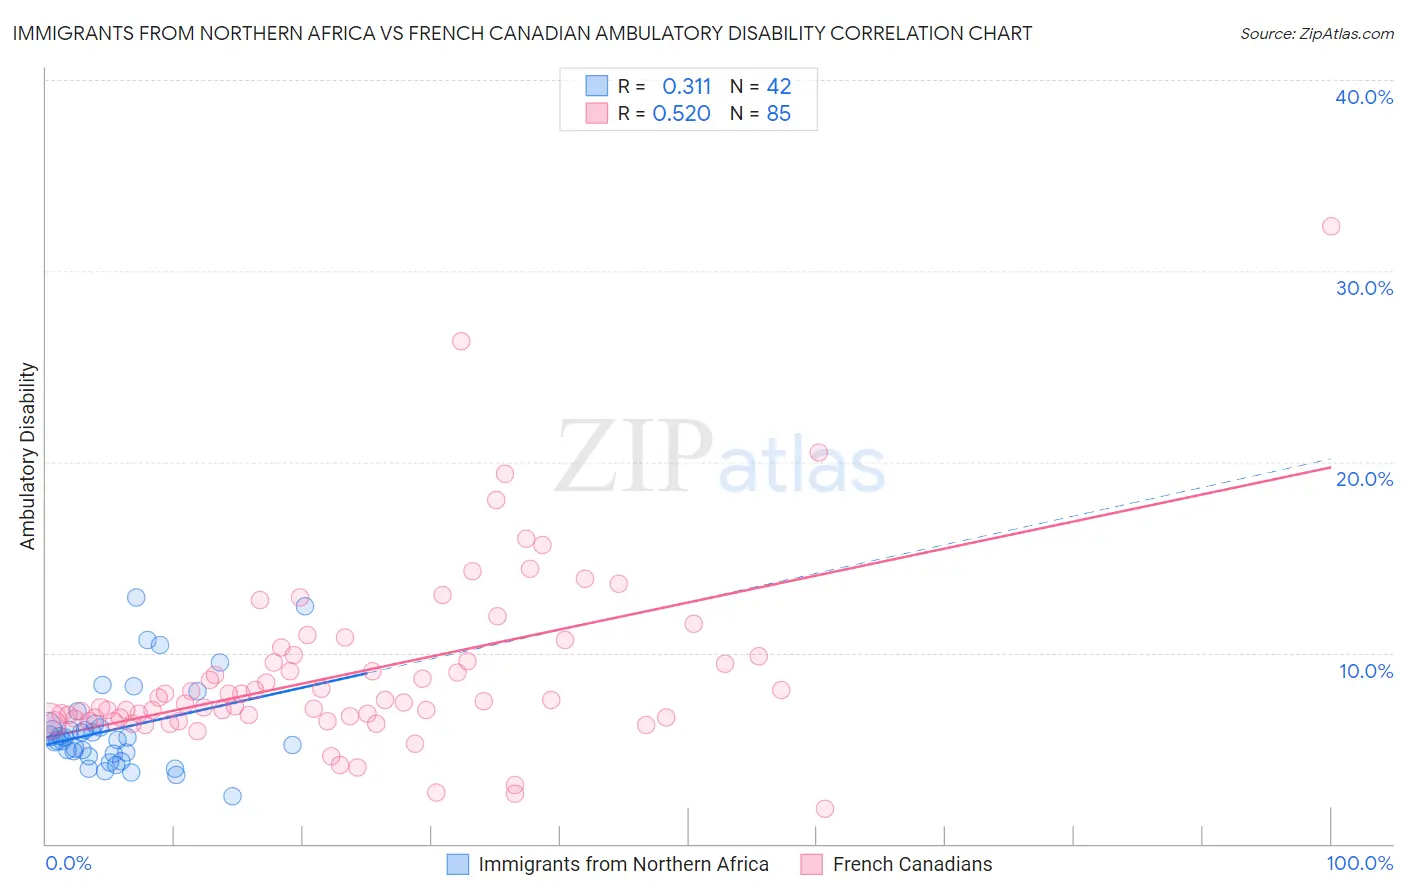
Immigrants from Northern Africa vs French Canadian Ambulatory Disability Correlation Chart
The statistical analysis conducted on geographies consisting of 321,147,957 people shows a mild positive correlation between the proportion of Immigrants from Northern Africa and percentage of population with ambulatory disability in the United States with a correlation coefficient (R) of 0.311 and weighted average of 5.7%. Similarly, the statistical analysis conducted on geographies consisting of 502,380,239 people shows a substantial positive correlation between the proportion of French Canadians and percentage of population with ambulatory disability in the United States with a correlation coefficient (R) of 0.520 and weighted average of 6.7%, a difference of 17.2%.
Ambulatory Disability Correlation Summary
| Measurement | Immigrants from Northern Africa | French Canadian |
| Minimum | 2.5% | 1.8% |
| Maximum | 12.9% | 32.4% |
| Range | 10.4% | 30.5% |
| Mean | 6.0% | 9.0% |
| Median | 5.5% | 7.4% |
| Interquartile 25% (IQ1) | 4.7% | 6.6% |
| Interquartile 75% (IQ3) | 6.1% | 9.9% |
| Interquartile Range (IQR) | 1.4% | 3.3% |
| Standard Deviation (Sample) | 2.3% | 4.7% |
| Standard Deviation (Population) | 2.3% | 4.7% |
Similar Demographics by Ambulatory Disability
Demographics Similar to Immigrants from Northern Africa by Ambulatory Disability
In terms of ambulatory disability, the demographic groups most similar to Immigrants from Northern Africa are Immigrants from Cameroon (5.7%, a difference of 0.010%), Brazilian (5.7%, a difference of 0.020%), Immigrants from Peru (5.7%, a difference of 0.040%), Immigrants from South Africa (5.7%, a difference of 0.060%), and Sudanese (5.7%, a difference of 0.080%).
| Demographics | Rating | Rank | Ambulatory Disability |
| Israelis | 99.6 /100 | #66 | Exceptional 5.7% |
| Immigrants | Uganda | 99.6 /100 | #67 | Exceptional 5.7% |
| Sri Lankans | 99.6 /100 | #68 | Exceptional 5.7% |
| Peruvians | 99.5 /100 | #69 | Exceptional 5.7% |
| Sierra Leoneans | 99.4 /100 | #70 | Exceptional 5.7% |
| Immigrants | Peru | 99.4 /100 | #71 | Exceptional 5.7% |
| Brazilians | 99.4 /100 | #72 | Exceptional 5.7% |
| Immigrants | Northern Africa | 99.4 /100 | #73 | Exceptional 5.7% |
| Immigrants | Cameroon | 99.4 /100 | #74 | Exceptional 5.7% |
| Immigrants | South Africa | 99.3 /100 | #75 | Exceptional 5.7% |
| Sudanese | 99.3 /100 | #76 | Exceptional 5.7% |
| Immigrants | Vietnam | 99.3 /100 | #77 | Exceptional 5.7% |
| Somalis | 99.2 /100 | #78 | Exceptional 5.7% |
| Chileans | 99.2 /100 | #79 | Exceptional 5.7% |
| Immigrants | Ireland | 99.2 /100 | #80 | Exceptional 5.7% |
Demographics Similar to French Canadians by Ambulatory Disability
In terms of ambulatory disability, the demographic groups most similar to French Canadians are White/Caucasian (6.7%, a difference of 0.020%), Sioux (6.7%, a difference of 0.26%), Immigrants from Guyana (6.7%, a difference of 0.32%), Celtic (6.7%, a difference of 0.35%), and Immigrants from Trinidad and Tobago (6.7%, a difference of 0.36%).
| Demographics | Rating | Rank | Ambulatory Disability |
| Bahamians | 0.2 /100 | #265 | Tragic 6.6% |
| Guyanese | 0.2 /100 | #266 | Tragic 6.6% |
| Trinidadians and Tobagonians | 0.2 /100 | #267 | Tragic 6.6% |
| Spanish | 0.2 /100 | #268 | Tragic 6.6% |
| French | 0.1 /100 | #269 | Tragic 6.6% |
| Slovaks | 0.1 /100 | #270 | Tragic 6.7% |
| Immigrants | Trinidad and Tobago | 0.1 /100 | #271 | Tragic 6.7% |
| French Canadians | 0.1 /100 | #272 | Tragic 6.7% |
| Whites/Caucasians | 0.1 /100 | #273 | Tragic 6.7% |
| Sioux | 0.1 /100 | #274 | Tragic 6.7% |
| Immigrants | Guyana | 0.1 /100 | #275 | Tragic 6.7% |
| Celtics | 0.1 /100 | #276 | Tragic 6.7% |
| Jamaicans | 0.1 /100 | #277 | Tragic 6.7% |
| Immigrants | West Indies | 0.1 /100 | #278 | Tragic 6.7% |
| Immigrants | Caribbean | 0.0 /100 | #279 | Tragic 6.7% |