Immigrants from North Macedonia vs Pima Seniors Poverty Over the Age of 65
COMPARE
Immigrants from North Macedonia
Pima
Seniors Poverty Over the Age of 65
Seniors Poverty Over the Age of 65 Comparison
Immigrants from North Macedonia
Pima
9.6%
SENIORS POVERTY OVER THE AGE OF 65
99.6/ 100
METRIC RATING
41st/ 347
METRIC RANK
19.8%
SENIORS POVERTY OVER THE AGE OF 65
0.0/ 100
METRIC RATING
345th/ 347
METRIC RANK
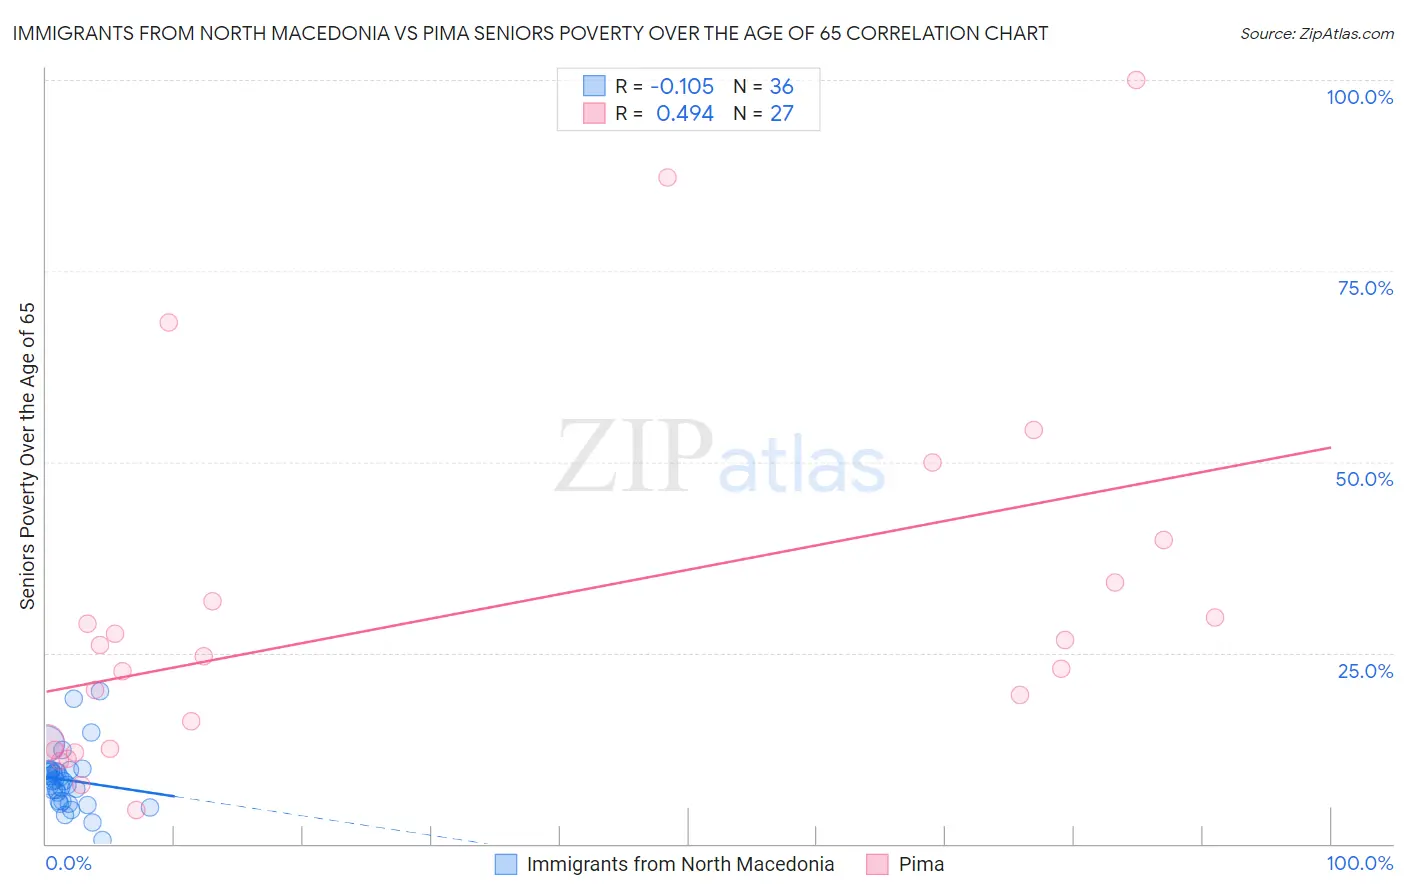
Immigrants from North Macedonia vs Pima Seniors Poverty Over the Age of 65 Correlation Chart
The statistical analysis conducted on geographies consisting of 74,265,150 people shows a poor negative correlation between the proportion of Immigrants from North Macedonia and poverty level among seniors over the age of 65 in the United States with a correlation coefficient (R) of -0.105 and weighted average of 9.6%. Similarly, the statistical analysis conducted on geographies consisting of 61,518,607 people shows a moderate positive correlation between the proportion of Pima and poverty level among seniors over the age of 65 in the United States with a correlation coefficient (R) of 0.494 and weighted average of 19.8%, a difference of 106.4%.
Seniors Poverty Over the Age of 65 Correlation Summary
| Measurement | Immigrants from North Macedonia | Pima |
| Minimum | 0.44% | 4.4% |
| Maximum | 20.0% | 100.0% |
| Range | 19.6% | 95.6% |
| Mean | 8.3% | 30.1% |
| Median | 8.1% | 24.6% |
| Interquartile 25% (IQ1) | 5.5% | 12.4% |
| Interquartile 75% (IQ3) | 9.6% | 34.3% |
| Interquartile Range (IQR) | 4.1% | 21.8% |
| Standard Deviation (Sample) | 3.9% | 23.6% |
| Standard Deviation (Population) | 3.9% | 23.1% |
Similar Demographics by Seniors Poverty Over the Age of 65
Demographics Similar to Immigrants from North Macedonia by Seniors Poverty Over the Age of 65
In terms of seniors poverty over the age of 65, the demographic groups most similar to Immigrants from North Macedonia are Zimbabwean (9.6%, a difference of 0.15%), Assyrian/Chaldean/Syriac (9.6%, a difference of 0.16%), Eastern European (9.6%, a difference of 0.26%), Greek (9.6%, a difference of 0.28%), and Austrian (9.6%, a difference of 0.35%).
| Demographics | Rating | Rank | Seniors Poverty Over the Age of 65 |
| British | 99.8 /100 | #34 | Exceptional 9.4% |
| Latvians | 99.8 /100 | #35 | Exceptional 9.5% |
| Czechoslovakians | 99.8 /100 | #36 | Exceptional 9.5% |
| Scotch-Irish | 99.7 /100 | #37 | Exceptional 9.5% |
| Belgians | 99.7 /100 | #38 | Exceptional 9.5% |
| Greeks | 99.6 /100 | #39 | Exceptional 9.6% |
| Assyrians/Chaldeans/Syriacs | 99.6 /100 | #40 | Exceptional 9.6% |
| Immigrants | North Macedonia | 99.6 /100 | #41 | Exceptional 9.6% |
| Zimbabweans | 99.6 /100 | #42 | Exceptional 9.6% |
| Eastern Europeans | 99.6 /100 | #43 | Exceptional 9.6% |
| Austrians | 99.5 /100 | #44 | Exceptional 9.6% |
| Estonians | 99.5 /100 | #45 | Exceptional 9.6% |
| Immigrants | Taiwan | 99.5 /100 | #46 | Exceptional 9.7% |
| Immigrants | South Central Asia | 99.5 /100 | #47 | Exceptional 9.7% |
| French | 99.5 /100 | #48 | Exceptional 9.7% |
Demographics Similar to Pima by Seniors Poverty Over the Age of 65
In terms of seniors poverty over the age of 65, the demographic groups most similar to Pima are Tohono O'odham (20.8%, a difference of 5.2%), Puerto Rican (21.4%, a difference of 8.1%), Immigrants from Dominican Republic (18.3%, a difference of 8.3%), Lumbee (18.1%, a difference of 9.3%), and Immigrants from Cuba (17.9%, a difference of 10.4%).
| Demographics | Rating | Rank | Seniors Poverty Over the Age of 65 |
| Immigrants | Yemen | 0.0 /100 | #333 | Tragic 15.9% |
| Immigrants | Nicaragua | 0.0 /100 | #334 | Tragic 15.9% |
| Cubans | 0.0 /100 | #335 | Tragic 16.1% |
| Immigrants | Cabo Verde | 0.0 /100 | #336 | Tragic 16.2% |
| Immigrants | Caribbean | 0.0 /100 | #337 | Tragic 16.5% |
| Pueblo | 0.0 /100 | #338 | Tragic 17.2% |
| Navajo | 0.0 /100 | #339 | Tragic 17.5% |
| Hopi | 0.0 /100 | #340 | Tragic 17.8% |
| Dominicans | 0.0 /100 | #341 | Tragic 17.8% |
| Immigrants | Cuba | 0.0 /100 | #342 | Tragic 17.9% |
| Lumbee | 0.0 /100 | #343 | Tragic 18.1% |
| Immigrants | Dominican Republic | 0.0 /100 | #344 | Tragic 18.3% |
| Pima | 0.0 /100 | #345 | Tragic 19.8% |
| Tohono O'odham | 0.0 /100 | #346 | Tragic 20.8% |
| Puerto Ricans | 0.0 /100 | #347 | Tragic 21.4% |