Immigrants from North Macedonia vs American Seniors Poverty Over the Age of 65
COMPARE
Immigrants from North Macedonia
American
Seniors Poverty Over the Age of 65
Seniors Poverty Over the Age of 65 Comparison
Immigrants from North Macedonia
Americans
9.6%
SENIORS POVERTY OVER THE AGE OF 65
99.6/ 100
METRIC RATING
41st/ 347
METRIC RANK
10.6%
SENIORS POVERTY OVER THE AGE OF 65
78.1/ 100
METRIC RATING
148th/ 347
METRIC RANK
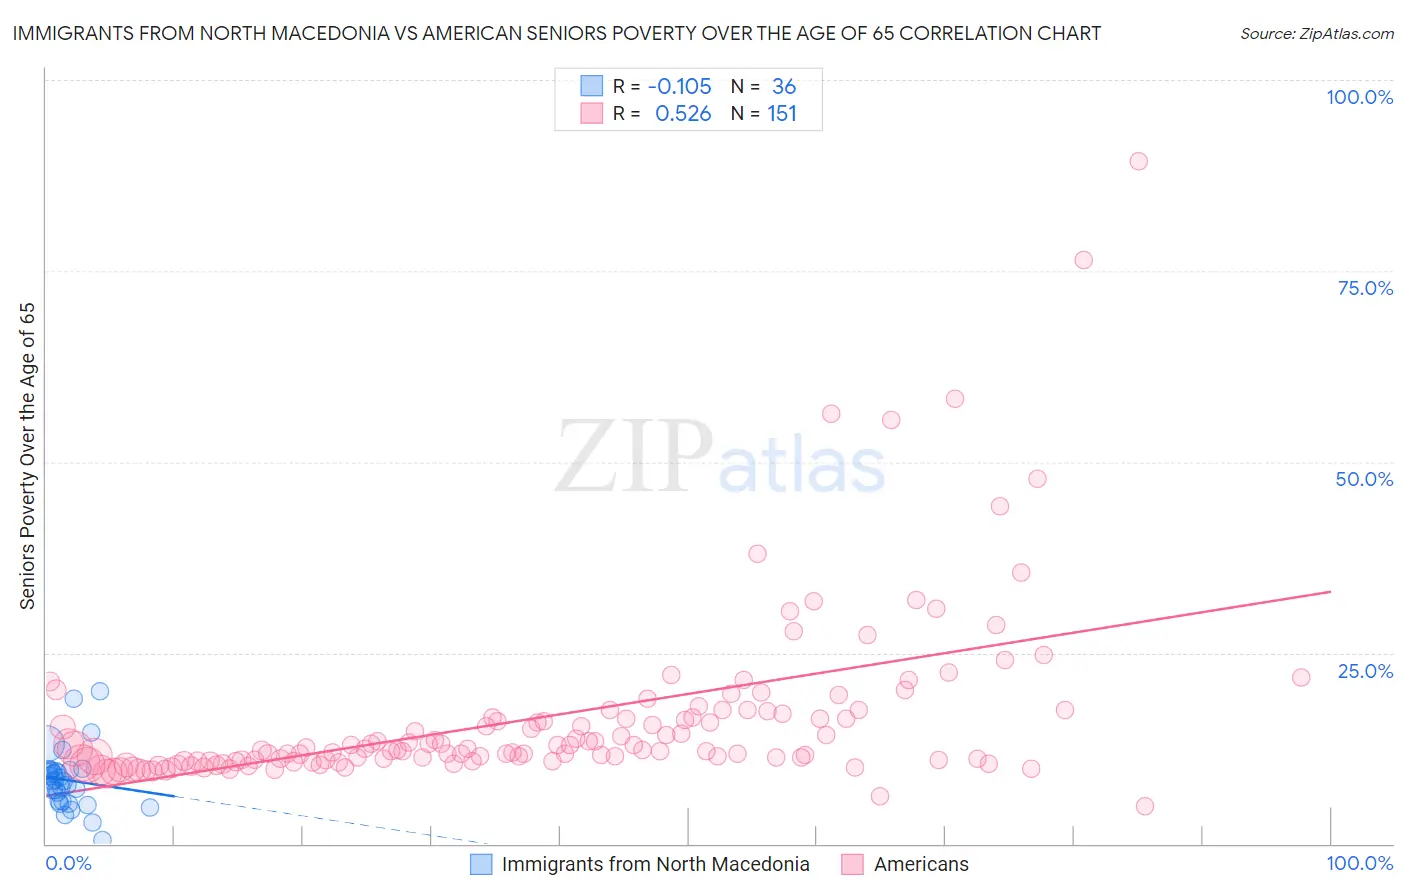
Immigrants from North Macedonia vs American Seniors Poverty Over the Age of 65 Correlation Chart
The statistical analysis conducted on geographies consisting of 74,265,150 people shows a poor negative correlation between the proportion of Immigrants from North Macedonia and poverty level among seniors over the age of 65 in the United States with a correlation coefficient (R) of -0.105 and weighted average of 9.6%. Similarly, the statistical analysis conducted on geographies consisting of 575,593,251 people shows a substantial positive correlation between the proportion of Americans and poverty level among seniors over the age of 65 in the United States with a correlation coefficient (R) of 0.526 and weighted average of 10.6%, a difference of 10.7%.
Seniors Poverty Over the Age of 65 Correlation Summary
| Measurement | Immigrants from North Macedonia | American |
| Minimum | 0.44% | 5.0% |
| Maximum | 20.0% | 89.4% |
| Range | 19.6% | 84.4% |
| Mean | 8.3% | 16.5% |
| Median | 8.1% | 12.4% |
| Interquartile 25% (IQ1) | 5.5% | 10.9% |
| Interquartile 75% (IQ3) | 9.6% | 17.0% |
| Interquartile Range (IQR) | 4.1% | 6.1% |
| Standard Deviation (Sample) | 3.9% | 11.8% |
| Standard Deviation (Population) | 3.9% | 11.7% |
Similar Demographics by Seniors Poverty Over the Age of 65
Demographics Similar to Immigrants from North Macedonia by Seniors Poverty Over the Age of 65
In terms of seniors poverty over the age of 65, the demographic groups most similar to Immigrants from North Macedonia are Zimbabwean (9.6%, a difference of 0.15%), Assyrian/Chaldean/Syriac (9.6%, a difference of 0.16%), Eastern European (9.6%, a difference of 0.26%), Greek (9.6%, a difference of 0.28%), and Austrian (9.6%, a difference of 0.35%).
| Demographics | Rating | Rank | Seniors Poverty Over the Age of 65 |
| British | 99.8 /100 | #34 | Exceptional 9.4% |
| Latvians | 99.8 /100 | #35 | Exceptional 9.5% |
| Czechoslovakians | 99.8 /100 | #36 | Exceptional 9.5% |
| Scotch-Irish | 99.7 /100 | #37 | Exceptional 9.5% |
| Belgians | 99.7 /100 | #38 | Exceptional 9.5% |
| Greeks | 99.6 /100 | #39 | Exceptional 9.6% |
| Assyrians/Chaldeans/Syriacs | 99.6 /100 | #40 | Exceptional 9.6% |
| Immigrants | North Macedonia | 99.6 /100 | #41 | Exceptional 9.6% |
| Zimbabweans | 99.6 /100 | #42 | Exceptional 9.6% |
| Eastern Europeans | 99.6 /100 | #43 | Exceptional 9.6% |
| Austrians | 99.5 /100 | #44 | Exceptional 9.6% |
| Estonians | 99.5 /100 | #45 | Exceptional 9.6% |
| Immigrants | Taiwan | 99.5 /100 | #46 | Exceptional 9.7% |
| Immigrants | South Central Asia | 99.5 /100 | #47 | Exceptional 9.7% |
| French | 99.5 /100 | #48 | Exceptional 9.7% |
Demographics Similar to Americans by Seniors Poverty Over the Age of 65
In terms of seniors poverty over the age of 65, the demographic groups most similar to Americans are Immigrants from Cameroon (10.6%, a difference of 0.0%), Immigrants from Switzerland (10.6%, a difference of 0.10%), Immigrants from Greece (10.6%, a difference of 0.13%), Alaskan Athabascan (10.6%, a difference of 0.14%), and Spanish (10.6%, a difference of 0.17%).
| Demographics | Rating | Rank | Seniors Poverty Over the Age of 65 |
| Immigrants | Europe | 83.3 /100 | #141 | Excellent 10.5% |
| Osage | 82.8 /100 | #142 | Excellent 10.6% |
| Immigrants | Asia | 80.8 /100 | #143 | Excellent 10.6% |
| Iraqis | 80.7 /100 | #144 | Excellent 10.6% |
| Laotians | 79.9 /100 | #145 | Good 10.6% |
| Alaskan Athabascans | 79.1 /100 | #146 | Good 10.6% |
| Immigrants | Greece | 79.0 /100 | #147 | Good 10.6% |
| Americans | 78.1 /100 | #148 | Good 10.6% |
| Immigrants | Cameroon | 78.1 /100 | #149 | Good 10.6% |
| Immigrants | Switzerland | 77.3 /100 | #150 | Good 10.6% |
| Spanish | 76.8 /100 | #151 | Good 10.6% |
| Immigrants | Egypt | 76.5 /100 | #152 | Good 10.6% |
| Fijians | 75.6 /100 | #153 | Good 10.7% |
| Immigrants | Saudi Arabia | 74.9 /100 | #154 | Good 10.7% |
| Chickasaw | 73.6 /100 | #155 | Good 10.7% |