Bhutanese vs Potawatomi Child Poverty Among Boys Under 16
COMPARE
Bhutanese
Potawatomi
Child Poverty Among Boys Under 16
Child Poverty Among Boys Under 16 Comparison
Bhutanese
Potawatomi
12.6%
CHILD POVERTY AMONG BOYS UNDER 16
100.0/ 100
METRIC RATING
10th/ 347
METRIC RANK
19.4%
CHILD POVERTY AMONG BOYS UNDER 16
0.2/ 100
METRIC RATING
258th/ 347
METRIC RANK
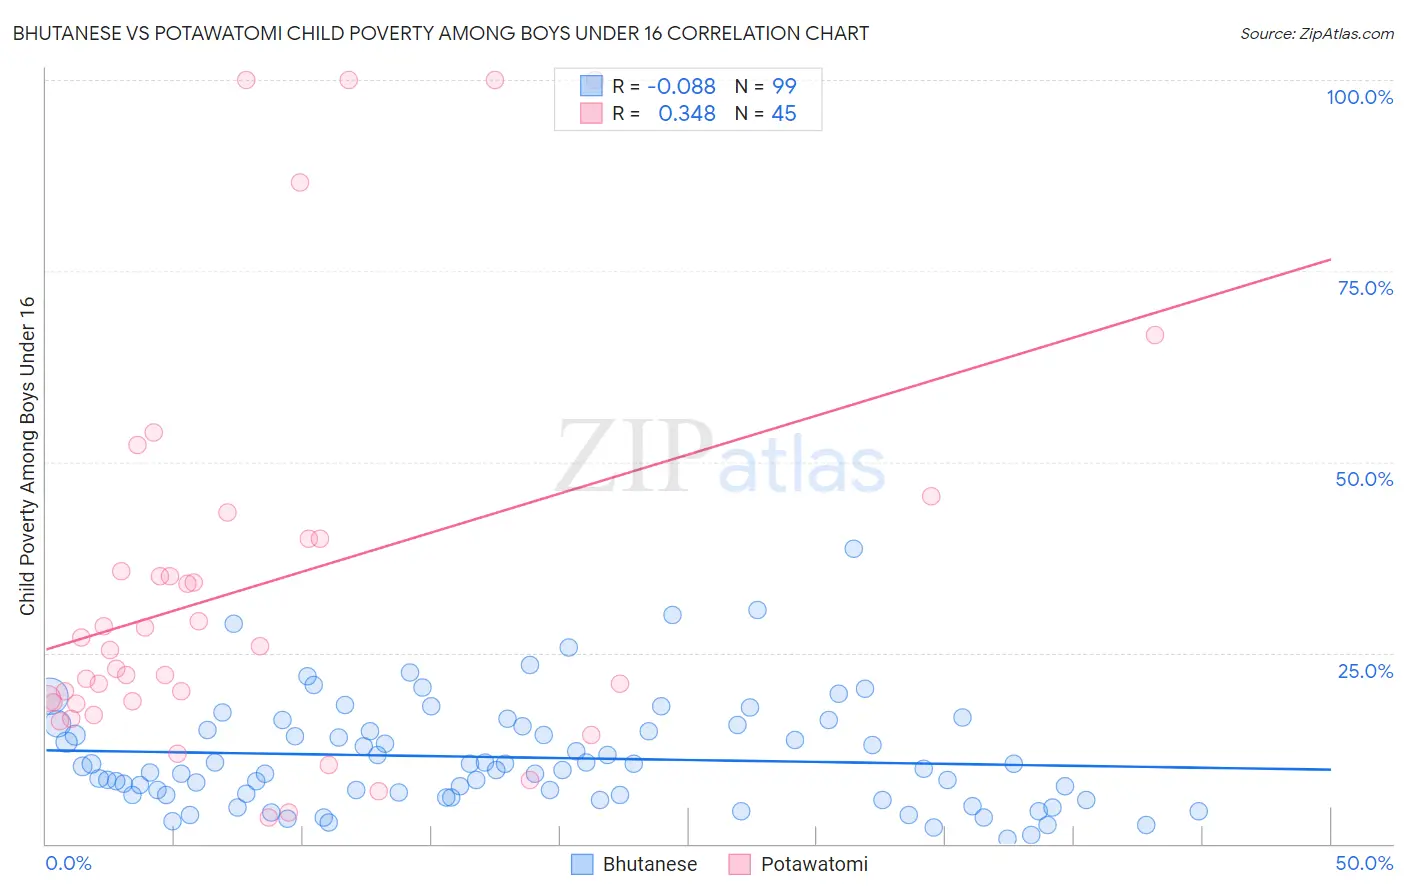
Bhutanese vs Potawatomi Child Poverty Among Boys Under 16 Correlation Chart
The statistical analysis conducted on geographies consisting of 446,468,872 people shows a slight negative correlation between the proportion of Bhutanese and poverty level among boys under the age of 16 in the United States with a correlation coefficient (R) of -0.088 and weighted average of 12.6%. Similarly, the statistical analysis conducted on geographies consisting of 117,214,140 people shows a mild positive correlation between the proportion of Potawatomi and poverty level among boys under the age of 16 in the United States with a correlation coefficient (R) of 0.348 and weighted average of 19.4%, a difference of 53.8%.
Child Poverty Among Boys Under 16 Correlation Summary
| Measurement | Bhutanese | Potawatomi |
| Minimum | 0.70% | 3.5% |
| Maximum | 38.6% | 100.0% |
| Range | 37.9% | 96.5% |
| Mean | 11.3% | 33.8% |
| Median | 9.8% | 25.4% |
| Interquartile 25% (IQ1) | 6.3% | 18.4% |
| Interquartile 75% (IQ3) | 15.3% | 40.0% |
| Interquartile Range (IQR) | 9.0% | 21.6% |
| Standard Deviation (Sample) | 7.1% | 26.3% |
| Standard Deviation (Population) | 7.0% | 26.0% |
Similar Demographics by Child Poverty Among Boys Under 16
Demographics Similar to Bhutanese by Child Poverty Among Boys Under 16
In terms of child poverty among boys under 16, the demographic groups most similar to Bhutanese are Immigrants from Iran (12.5%, a difference of 0.36%), Immigrants from South Central Asia (12.7%, a difference of 0.52%), Immigrants from Singapore (12.5%, a difference of 0.86%), Iranian (12.4%, a difference of 1.2%), and Immigrants from Hong Kong (12.3%, a difference of 2.8%).
| Demographics | Rating | Rank | Child Poverty Among Boys Under 16 |
| Filipinos | 100.0 /100 | #3 | Exceptional 11.1% |
| Thais | 100.0 /100 | #4 | Exceptional 11.7% |
| Chinese | 100.0 /100 | #5 | Exceptional 11.9% |
| Immigrants | Hong Kong | 100.0 /100 | #6 | Exceptional 12.3% |
| Iranians | 100.0 /100 | #7 | Exceptional 12.4% |
| Immigrants | Singapore | 100.0 /100 | #8 | Exceptional 12.5% |
| Immigrants | Iran | 100.0 /100 | #9 | Exceptional 12.5% |
| Bhutanese | 100.0 /100 | #10 | Exceptional 12.6% |
| Immigrants | South Central Asia | 100.0 /100 | #11 | Exceptional 12.7% |
| Burmese | 99.9 /100 | #12 | Exceptional 13.0% |
| Immigrants | Korea | 99.9 /100 | #13 | Exceptional 13.0% |
| Immigrants | Ireland | 99.9 /100 | #14 | Exceptional 13.1% |
| Immigrants | Japan | 99.9 /100 | #15 | Exceptional 13.1% |
| Maltese | 99.9 /100 | #16 | Exceptional 13.2% |
| Norwegians | 99.9 /100 | #17 | Exceptional 13.2% |
Demographics Similar to Potawatomi by Child Poverty Among Boys Under 16
In terms of child poverty among boys under 16, the demographic groups most similar to Potawatomi are Mexican American Indian (19.4%, a difference of 0.020%), Spanish American (19.4%, a difference of 0.020%), Shoshone (19.4%, a difference of 0.12%), Immigrants from Ghana (19.4%, a difference of 0.13%), and Immigrants from Liberia (19.3%, a difference of 0.22%).
| Demographics | Rating | Rank | Child Poverty Among Boys Under 16 |
| French American Indians | 0.2 /100 | #251 | Tragic 19.2% |
| Immigrants | Western Africa | 0.2 /100 | #252 | Tragic 19.3% |
| Liberians | 0.2 /100 | #253 | Tragic 19.3% |
| Trinidadians and Tobagonians | 0.2 /100 | #254 | Tragic 19.3% |
| Ecuadorians | 0.2 /100 | #255 | Tragic 19.3% |
| Immigrants | Liberia | 0.2 /100 | #256 | Tragic 19.3% |
| Mexican American Indians | 0.2 /100 | #257 | Tragic 19.4% |
| Potawatomi | 0.2 /100 | #258 | Tragic 19.4% |
| Spanish Americans | 0.2 /100 | #259 | Tragic 19.4% |
| Shoshone | 0.2 /100 | #260 | Tragic 19.4% |
| Immigrants | Ghana | 0.2 /100 | #261 | Tragic 19.4% |
| Immigrants | Guyana | 0.1 /100 | #262 | Tragic 19.5% |
| Ottawa | 0.1 /100 | #263 | Tragic 19.5% |
| Iroquois | 0.1 /100 | #264 | Tragic 19.6% |
| Guyanese | 0.1 /100 | #265 | Tragic 19.6% |