Immigrants from North America vs Paiute Child Poverty Among Boys Under 16
COMPARE
Immigrants from North America
Paiute
Child Poverty Among Boys Under 16
Child Poverty Among Boys Under 16 Comparison
Immigrants from North America
Paiute
14.8%
CHILD POVERTY AMONG BOYS UNDER 16
97.1/ 100
METRIC RATING
88th/ 347
METRIC RANK
22.8%
CHILD POVERTY AMONG BOYS UNDER 16
0.0/ 100
METRIC RATING
326th/ 347
METRIC RANK
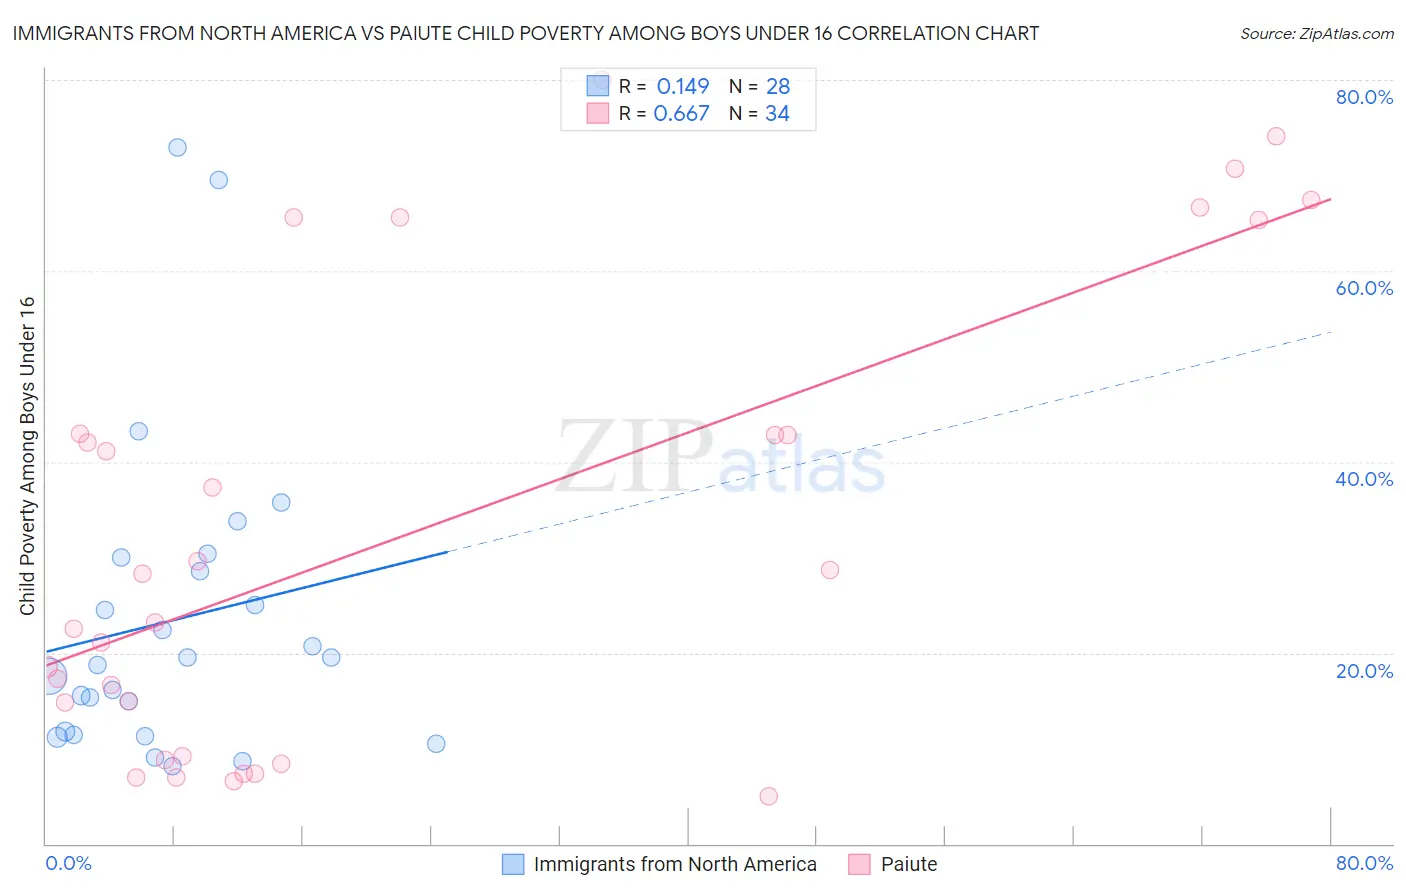
Immigrants from North America vs Paiute Child Poverty Among Boys Under 16 Correlation Chart
The statistical analysis conducted on geographies consisting of 451,303,762 people shows a poor positive correlation between the proportion of Immigrants from North America and poverty level among boys under the age of 16 in the United States with a correlation coefficient (R) of 0.149 and weighted average of 14.8%. Similarly, the statistical analysis conducted on geographies consisting of 58,198,272 people shows a significant positive correlation between the proportion of Paiute and poverty level among boys under the age of 16 in the United States with a correlation coefficient (R) of 0.667 and weighted average of 22.8%, a difference of 53.7%.
Child Poverty Among Boys Under 16 Correlation Summary
| Measurement | Immigrants from North America | Paiute |
| Minimum | 8.1% | 4.9% |
| Maximum | 72.9% | 80.0% |
| Range | 64.8% | 75.1% |
| Mean | 23.4% | 32.5% |
| Median | 19.1% | 25.7% |
| Interquartile 25% (IQ1) | 11.6% | 9.2% |
| Interquartile 75% (IQ3) | 29.3% | 43.0% |
| Interquartile Range (IQR) | 17.7% | 33.8% |
| Standard Deviation (Sample) | 16.2% | 24.0% |
| Standard Deviation (Population) | 15.9% | 23.6% |
Similar Demographics by Child Poverty Among Boys Under 16
Demographics Similar to Immigrants from North America by Child Poverty Among Boys Under 16
In terms of child poverty among boys under 16, the demographic groups most similar to Immigrants from North America are Northern European (14.8%, a difference of 0.020%), German (14.8%, a difference of 0.070%), Immigrants from Argentina (14.8%, a difference of 0.070%), Austrian (14.8%, a difference of 0.090%), and Taiwanese (14.8%, a difference of 0.13%).
| Demographics | Rating | Rank | Child Poverty Among Boys Under 16 |
| Immigrants | Canada | 97.6 /100 | #81 | Exceptional 14.7% |
| Ukrainians | 97.6 /100 | #82 | Exceptional 14.7% |
| Immigrants | South Africa | 97.4 /100 | #83 | Exceptional 14.8% |
| Swiss | 97.3 /100 | #84 | Exceptional 14.8% |
| Taiwanese | 97.3 /100 | #85 | Exceptional 14.8% |
| Germans | 97.2 /100 | #86 | Exceptional 14.8% |
| Northern Europeans | 97.2 /100 | #87 | Exceptional 14.8% |
| Immigrants | North America | 97.1 /100 | #88 | Exceptional 14.8% |
| Immigrants | Argentina | 97.1 /100 | #89 | Exceptional 14.8% |
| Austrians | 97.1 /100 | #90 | Exceptional 14.8% |
| Paraguayans | 96.8 /100 | #91 | Exceptional 14.9% |
| Argentineans | 96.7 /100 | #92 | Exceptional 14.9% |
| Sri Lankans | 96.7 /100 | #93 | Exceptional 14.9% |
| Immigrants | Italy | 96.7 /100 | #94 | Exceptional 14.9% |
| Finns | 96.5 /100 | #95 | Exceptional 14.9% |
Demographics Similar to Paiute by Child Poverty Among Boys Under 16
In terms of child poverty among boys under 16, the demographic groups most similar to Paiute are Immigrants from Honduras (22.8%, a difference of 0.12%), Central American Indian (22.5%, a difference of 1.1%), Immigrants from Congo (22.4%, a difference of 1.7%), Honduran (22.3%, a difference of 2.0%), and Immigrants from Dominica (22.2%, a difference of 2.6%).
| Demographics | Rating | Rank | Child Poverty Among Boys Under 16 |
| Dutch West Indians | 0.0 /100 | #319 | Tragic 21.8% |
| U.S. Virgin Islanders | 0.0 /100 | #320 | Tragic 22.0% |
| Cajuns | 0.0 /100 | #321 | Tragic 22.2% |
| Immigrants | Dominica | 0.0 /100 | #322 | Tragic 22.2% |
| Hondurans | 0.0 /100 | #323 | Tragic 22.3% |
| Immigrants | Congo | 0.0 /100 | #324 | Tragic 22.4% |
| Central American Indians | 0.0 /100 | #325 | Tragic 22.5% |
| Paiute | 0.0 /100 | #326 | Tragic 22.8% |
| Immigrants | Honduras | 0.0 /100 | #327 | Tragic 22.8% |
| Pueblo | 0.0 /100 | #328 | Tragic 23.5% |
| Natives/Alaskans | 0.0 /100 | #329 | Tragic 24.0% |
| Colville | 0.0 /100 | #330 | Tragic 24.1% |
| Dominicans | 0.0 /100 | #331 | Tragic 24.2% |
| Immigrants | Dominican Republic | 0.0 /100 | #332 | Tragic 24.3% |
| Apache | 0.0 /100 | #333 | Tragic 24.5% |