Immigrants from Nigeria vs Native Hawaiian Female Poverty Among 18-24 Year Olds
COMPARE
Immigrants from Nigeria
Native Hawaiian
Female Poverty Among 18-24 Year Olds
Female Poverty Among 18-24 Year Olds Comparison
Immigrants from Nigeria
Native Hawaiians
20.1%
FEMALE POVERTY AMONG 18-24 YEAR OLDS
54.3/ 100
METRIC RATING
171st/ 347
METRIC RANK
17.9%
FEMALE POVERTY AMONG 18-24 YEAR OLDS
100.0/ 100
METRIC RATING
33rd/ 347
METRIC RANK
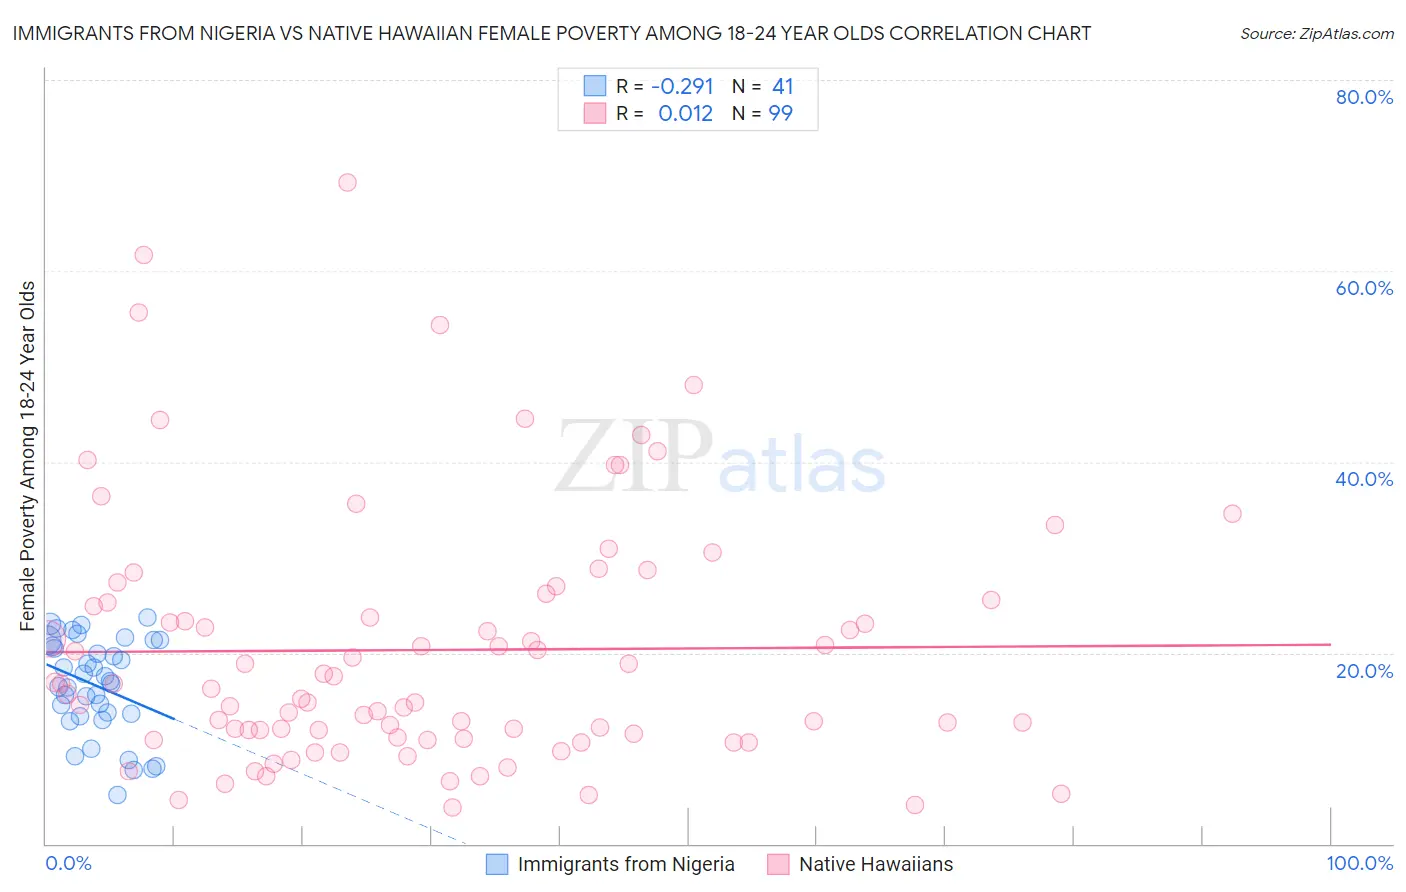
Immigrants from Nigeria vs Native Hawaiian Female Poverty Among 18-24 Year Olds Correlation Chart
The statistical analysis conducted on geographies consisting of 279,729,730 people shows a weak negative correlation between the proportion of Immigrants from Nigeria and poverty level among females between the ages 18 and 24 in the United States with a correlation coefficient (R) of -0.291 and weighted average of 20.1%. Similarly, the statistical analysis conducted on geographies consisting of 326,689,042 people shows no correlation between the proportion of Native Hawaiians and poverty level among females between the ages 18 and 24 in the United States with a correlation coefficient (R) of 0.012 and weighted average of 17.9%, a difference of 12.3%.
Female Poverty Among 18-24 Year Olds Correlation Summary
| Measurement | Immigrants from Nigeria | Native Hawaiian |
| Minimum | 5.1% | 3.8% |
| Maximum | 23.7% | 69.3% |
| Range | 18.6% | 65.5% |
| Mean | 16.6% | 20.3% |
| Median | 17.1% | 16.2% |
| Interquartile 25% (IQ1) | 13.5% | 11.1% |
| Interquartile 75% (IQ3) | 21.0% | 25.6% |
| Interquartile Range (IQR) | 7.5% | 14.5% |
| Standard Deviation (Sample) | 5.0% | 13.3% |
| Standard Deviation (Population) | 4.9% | 13.2% |
Similar Demographics by Female Poverty Among 18-24 Year Olds
Demographics Similar to Immigrants from Nigeria by Female Poverty Among 18-24 Year Olds
In terms of female poverty among 18-24 year olds, the demographic groups most similar to Immigrants from Nigeria are Iranian (20.1%, a difference of 0.020%), Hmong (20.0%, a difference of 0.060%), Belizean (20.1%, a difference of 0.11%), Irish (20.1%, a difference of 0.21%), and Swedish (20.1%, a difference of 0.21%).
| Demographics | Rating | Rank | Female Poverty Among 18-24 Year Olds |
| Central Americans | 70.0 /100 | #164 | Good 19.9% |
| Eastern Europeans | 69.3 /100 | #165 | Good 19.9% |
| Belgians | 69.1 /100 | #166 | Good 19.9% |
| Czechoslovakians | 61.8 /100 | #167 | Good 20.0% |
| Fijians | 59.1 /100 | #168 | Average 20.0% |
| Hmong | 55.4 /100 | #169 | Average 20.0% |
| Iranians | 54.7 /100 | #170 | Average 20.1% |
| Immigrants | Nigeria | 54.3 /100 | #171 | Average 20.1% |
| Belizeans | 52.0 /100 | #172 | Average 20.1% |
| Irish | 50.0 /100 | #173 | Average 20.1% |
| Swedes | 50.0 /100 | #174 | Average 20.1% |
| South American Indians | 48.4 /100 | #175 | Average 20.1% |
| Kenyans | 44.9 /100 | #176 | Average 20.2% |
| Immigrants | Kazakhstan | 44.2 /100 | #177 | Average 20.2% |
| Swiss | 44.0 /100 | #178 | Average 20.2% |
Demographics Similar to Native Hawaiians by Female Poverty Among 18-24 Year Olds
In terms of female poverty among 18-24 year olds, the demographic groups most similar to Native Hawaiians are Immigrants from Moldova (17.9%, a difference of 0.030%), Immigrants from Nicaragua (17.9%, a difference of 0.12%), Immigrants from Greece (17.9%, a difference of 0.15%), Immigrants from South America (17.9%, a difference of 0.20%), and Immigrants from Croatia (17.9%, a difference of 0.26%).
| Demographics | Rating | Rank | Female Poverty Among 18-24 Year Olds |
| Immigrants | Fiji | 100.0 /100 | #26 | Exceptional 17.7% |
| Colombians | 100.0 /100 | #27 | Exceptional 17.7% |
| Venezuelans | 100.0 /100 | #28 | Exceptional 17.7% |
| Portuguese | 100.0 /100 | #29 | Exceptional 17.8% |
| Immigrants | South Eastern Asia | 100.0 /100 | #30 | Exceptional 17.8% |
| Immigrants | Vietnam | 100.0 /100 | #31 | Exceptional 17.8% |
| Immigrants | Moldova | 100.0 /100 | #32 | Exceptional 17.9% |
| Native Hawaiians | 100.0 /100 | #33 | Exceptional 17.9% |
| Immigrants | Nicaragua | 100.0 /100 | #34 | Exceptional 17.9% |
| Immigrants | Greece | 100.0 /100 | #35 | Exceptional 17.9% |
| Immigrants | South America | 100.0 /100 | #36 | Exceptional 17.9% |
| Immigrants | Croatia | 100.0 /100 | #37 | Exceptional 17.9% |
| South Americans | 100.0 /100 | #38 | Exceptional 18.0% |
| Puget Sound Salish | 100.0 /100 | #39 | Exceptional 18.0% |
| Immigrants | Romania | 100.0 /100 | #40 | Exceptional 18.0% |