Filipino vs Immigrants from Panama Child Poverty Among Boys Under 16
COMPARE
Filipino
Immigrants from Panama
Child Poverty Among Boys Under 16
Child Poverty Among Boys Under 16 Comparison
Filipinos
Immigrants from Panama
11.1%
CHILD POVERTY AMONG BOYS UNDER 16
100.0/ 100
METRIC RATING
3rd/ 347
METRIC RANK
17.9%
CHILD POVERTY AMONG BOYS UNDER 16
4.3/ 100
METRIC RATING
221st/ 347
METRIC RANK
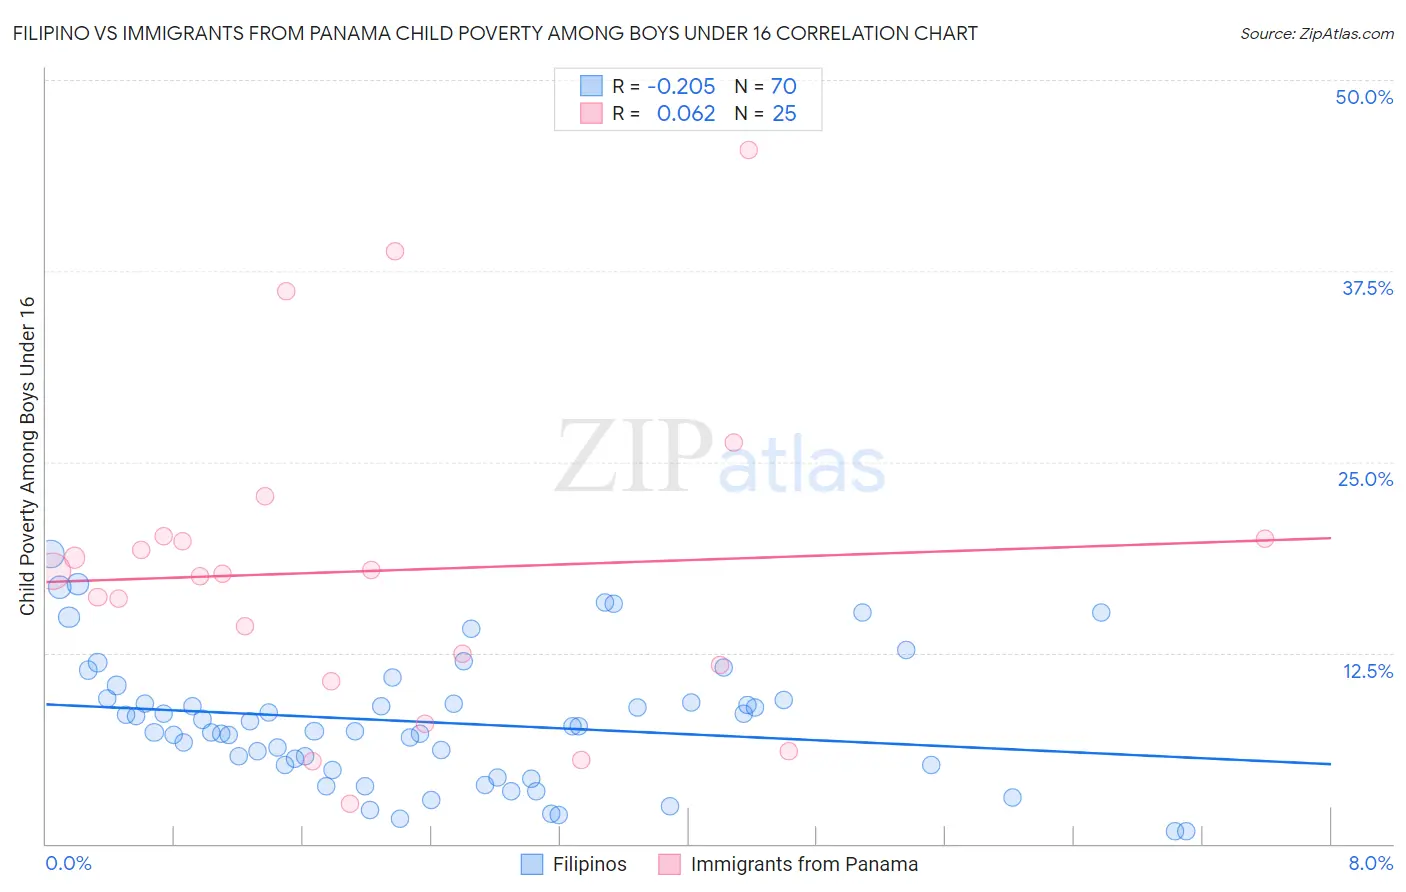
Filipino vs Immigrants from Panama Child Poverty Among Boys Under 16 Correlation Chart
The statistical analysis conducted on geographies consisting of 250,988,571 people shows a weak negative correlation between the proportion of Filipinos and poverty level among boys under the age of 16 in the United States with a correlation coefficient (R) of -0.205 and weighted average of 11.1%. Similarly, the statistical analysis conducted on geographies consisting of 219,900,971 people shows a slight positive correlation between the proportion of Immigrants from Panama and poverty level among boys under the age of 16 in the United States with a correlation coefficient (R) of 0.062 and weighted average of 17.9%, a difference of 60.7%.
Child Poverty Among Boys Under 16 Correlation Summary
| Measurement | Filipino | Immigrants from Panama |
| Minimum | 0.83% | 2.7% |
| Maximum | 19.0% | 45.5% |
| Range | 18.1% | 42.8% |
| Mean | 7.9% | 17.9% |
| Median | 7.5% | 17.7% |
| Interquartile 25% (IQ1) | 5.1% | 11.1% |
| Interquartile 75% (IQ3) | 9.4% | 20.1% |
| Interquartile Range (IQR) | 4.3% | 8.9% |
| Standard Deviation (Sample) | 4.2% | 10.3% |
| Standard Deviation (Population) | 4.1% | 10.1% |
Similar Demographics by Child Poverty Among Boys Under 16
Demographics Similar to Filipinos by Child Poverty Among Boys Under 16
In terms of child poverty among boys under 16, the demographic groups most similar to Filipinos are Immigrants from Taiwan (11.0%, a difference of 0.78%), Immigrants from India (10.9%, a difference of 2.3%), Thai (11.7%, a difference of 5.1%), Chinese (11.9%, a difference of 6.8%), and Immigrants from Hong Kong (12.3%, a difference of 10.2%).
| Demographics | Rating | Rank | Child Poverty Among Boys Under 16 |
| Immigrants | India | 100.0 /100 | #1 | Exceptional 10.9% |
| Immigrants | Taiwan | 100.0 /100 | #2 | Exceptional 11.0% |
| Filipinos | 100.0 /100 | #3 | Exceptional 11.1% |
| Thais | 100.0 /100 | #4 | Exceptional 11.7% |
| Chinese | 100.0 /100 | #5 | Exceptional 11.9% |
| Immigrants | Hong Kong | 100.0 /100 | #6 | Exceptional 12.3% |
| Iranians | 100.0 /100 | #7 | Exceptional 12.4% |
| Immigrants | Singapore | 100.0 /100 | #8 | Exceptional 12.5% |
| Immigrants | Iran | 100.0 /100 | #9 | Exceptional 12.5% |
| Bhutanese | 100.0 /100 | #10 | Exceptional 12.6% |
| Immigrants | South Central Asia | 100.0 /100 | #11 | Exceptional 12.7% |
| Burmese | 99.9 /100 | #12 | Exceptional 13.0% |
| Immigrants | Korea | 99.9 /100 | #13 | Exceptional 13.0% |
| Immigrants | Ireland | 99.9 /100 | #14 | Exceptional 13.1% |
| Immigrants | Japan | 99.9 /100 | #15 | Exceptional 13.1% |
Demographics Similar to Immigrants from Panama by Child Poverty Among Boys Under 16
In terms of child poverty among boys under 16, the demographic groups most similar to Immigrants from Panama are Pennsylvania German (17.9%, a difference of 0.23%), Cuban (17.9%, a difference of 0.32%), Immigrants from Cambodia (17.8%, a difference of 0.47%), Sierra Leonean (17.8%, a difference of 0.60%), and Iraqi (17.7%, a difference of 0.68%).
| Demographics | Rating | Rank | Child Poverty Among Boys Under 16 |
| Panamanians | 5.9 /100 | #214 | Tragic 17.7% |
| Osage | 5.8 /100 | #215 | Tragic 17.7% |
| Moroccans | 5.6 /100 | #216 | Tragic 17.7% |
| Japanese | 5.5 /100 | #217 | Tragic 17.7% |
| Iraqis | 5.5 /100 | #218 | Tragic 17.7% |
| Sierra Leoneans | 5.3 /100 | #219 | Tragic 17.8% |
| Immigrants | Cambodia | 5.1 /100 | #220 | Tragic 17.8% |
| Immigrants | Panama | 4.3 /100 | #221 | Tragic 17.9% |
| Pennsylvania Germans | 3.9 /100 | #222 | Tragic 17.9% |
| Cubans | 3.8 /100 | #223 | Tragic 17.9% |
| Nepalese | 3.2 /100 | #224 | Tragic 18.0% |
| Inupiat | 2.7 /100 | #225 | Tragic 18.1% |
| Immigrants | Africa | 2.6 /100 | #226 | Tragic 18.1% |
| Bermudans | 2.5 /100 | #227 | Tragic 18.1% |
| Immigrants | Nonimmigrants | 2.2 /100 | #228 | Tragic 18.2% |