Nicaraguan vs Immigrants from Panama Child Poverty Among Boys Under 16
COMPARE
Nicaraguan
Immigrants from Panama
Child Poverty Among Boys Under 16
Child Poverty Among Boys Under 16 Comparison
Nicaraguans
Immigrants from Panama
18.4%
CHILD POVERTY AMONG BOYS UNDER 16
1.4/ 100
METRIC RATING
231st/ 347
METRIC RANK
17.9%
CHILD POVERTY AMONG BOYS UNDER 16
4.3/ 100
METRIC RATING
221st/ 347
METRIC RANK
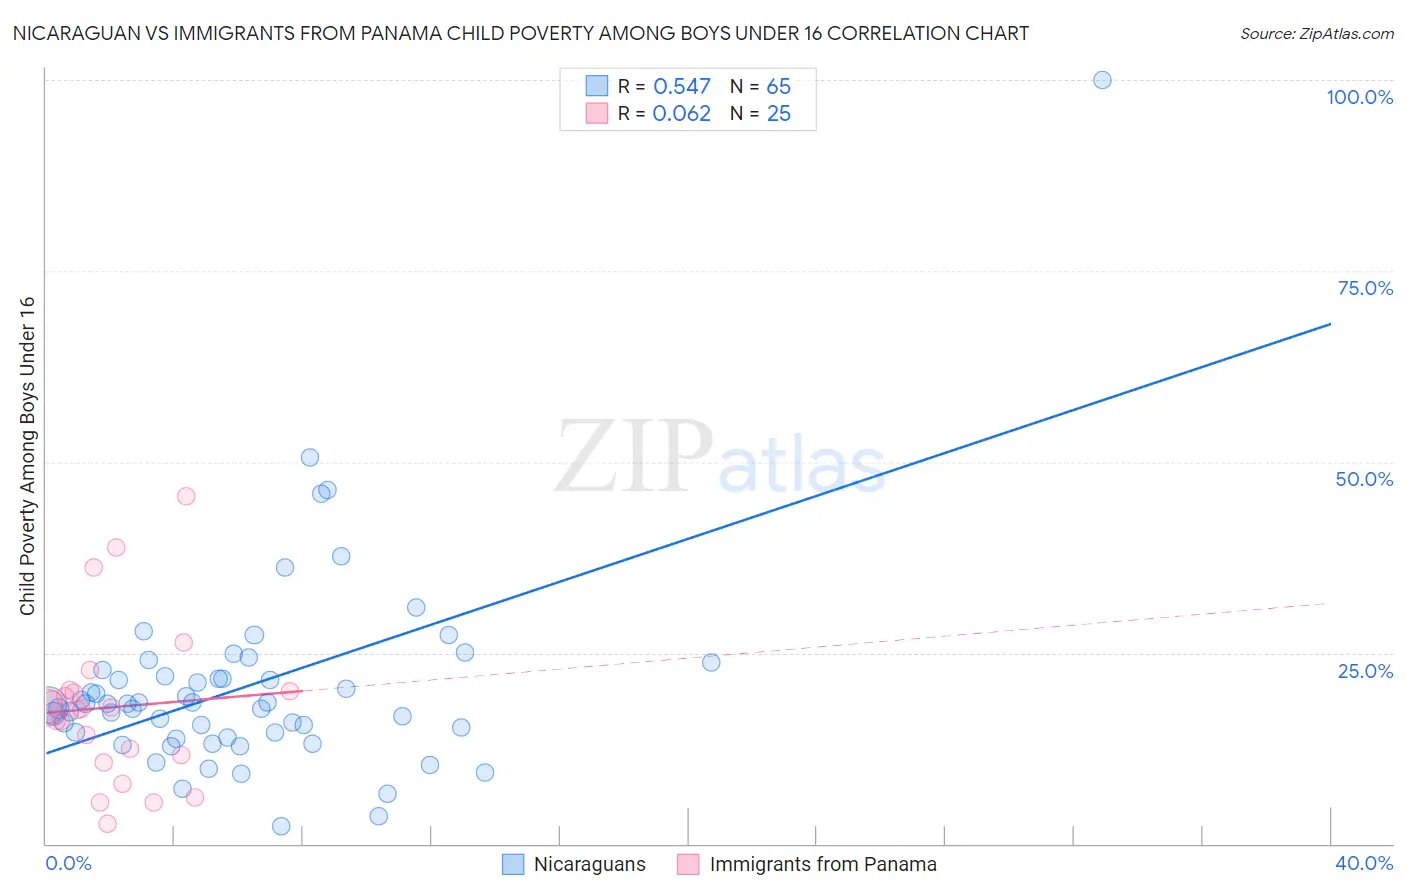
Nicaraguan vs Immigrants from Panama Child Poverty Among Boys Under 16 Correlation Chart
The statistical analysis conducted on geographies consisting of 283,666,895 people shows a substantial positive correlation between the proportion of Nicaraguans and poverty level among boys under the age of 16 in the United States with a correlation coefficient (R) of 0.547 and weighted average of 18.4%. Similarly, the statistical analysis conducted on geographies consisting of 219,900,971 people shows a slight positive correlation between the proportion of Immigrants from Panama and poverty level among boys under the age of 16 in the United States with a correlation coefficient (R) of 0.062 and weighted average of 17.9%, a difference of 2.9%.
Child Poverty Among Boys Under 16 Correlation Summary
| Measurement | Nicaraguan | Immigrants from Panama |
| Minimum | 2.3% | 2.7% |
| Maximum | 100.0% | 45.5% |
| Range | 97.7% | 42.8% |
| Mean | 20.6% | 17.9% |
| Median | 18.3% | 17.7% |
| Interquartile 25% (IQ1) | 14.3% | 11.1% |
| Interquartile 75% (IQ3) | 22.4% | 20.1% |
| Interquartile Range (IQR) | 8.1% | 8.9% |
| Standard Deviation (Sample) | 13.5% | 10.3% |
| Standard Deviation (Population) | 13.4% | 10.1% |
Demographics Similar to Nicaraguans and Immigrants from Panama by Child Poverty Among Boys Under 16
In terms of child poverty among boys under 16, the demographic groups most similar to Nicaraguans are Marshallese (18.4%, a difference of 0.20%), Immigrants from Nigeria (18.4%, a difference of 0.39%), Immigrants from Micronesia (18.3%, a difference of 0.53%), Fijian (18.3%, a difference of 0.53%), and Nigerian (18.5%, a difference of 0.64%). Similarly, the demographic groups most similar to Immigrants from Panama are Pennsylvania German (17.9%, a difference of 0.23%), Cuban (17.9%, a difference of 0.32%), Immigrants from Cambodia (17.8%, a difference of 0.47%), Sierra Leonean (17.8%, a difference of 0.60%), and Iraqi (17.7%, a difference of 0.68%).
| Demographics | Rating | Rank | Child Poverty Among Boys Under 16 |
| Moroccans | 5.6 /100 | #216 | Tragic 17.7% |
| Japanese | 5.5 /100 | #217 | Tragic 17.7% |
| Iraqis | 5.5 /100 | #218 | Tragic 17.7% |
| Sierra Leoneans | 5.3 /100 | #219 | Tragic 17.8% |
| Immigrants | Cambodia | 5.1 /100 | #220 | Tragic 17.8% |
| Immigrants | Panama | 4.3 /100 | #221 | Tragic 17.9% |
| Pennsylvania Germans | 3.9 /100 | #222 | Tragic 17.9% |
| Cubans | 3.8 /100 | #223 | Tragic 17.9% |
| Nepalese | 3.2 /100 | #224 | Tragic 18.0% |
| Inupiat | 2.7 /100 | #225 | Tragic 18.1% |
| Immigrants | Africa | 2.6 /100 | #226 | Tragic 18.1% |
| Bermudans | 2.5 /100 | #227 | Tragic 18.1% |
| Immigrants | Nonimmigrants | 2.2 /100 | #228 | Tragic 18.2% |
| Immigrants | Micronesia | 1.8 /100 | #229 | Tragic 18.3% |
| Fijians | 1.8 /100 | #230 | Tragic 18.3% |
| Nicaraguans | 1.4 /100 | #231 | Tragic 18.4% |
| Marshallese | 1.3 /100 | #232 | Tragic 18.4% |
| Immigrants | Nigeria | 1.2 /100 | #233 | Tragic 18.4% |
| Nigerians | 1.1 /100 | #234 | Tragic 18.5% |
| Americans | 0.9 /100 | #235 | Tragic 18.6% |
| Sudanese | 0.9 /100 | #236 | Tragic 18.6% |