Immigrants from Netherlands vs Panamanian Male Disability
COMPARE
Immigrants from Netherlands
Panamanian
Male Disability
Male Disability Comparison
Immigrants from Netherlands
Panamanians
11.4%
MALE DISABILITY
25.9/ 100
METRIC RATING
189th/ 347
METRIC RANK
11.7%
MALE DISABILITY
3.8/ 100
METRIC RATING
219th/ 347
METRIC RANK
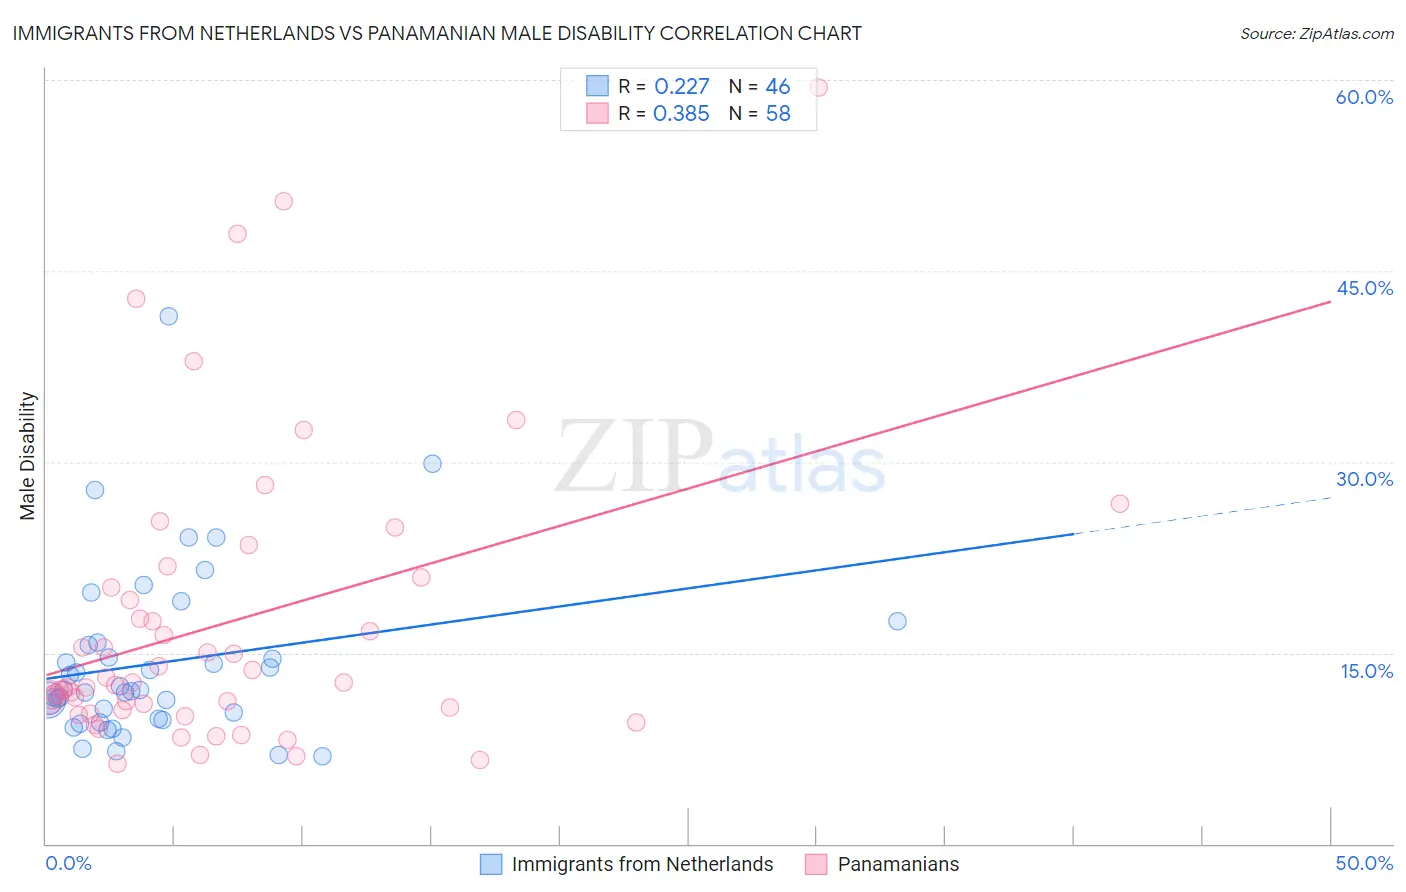
Immigrants from Netherlands vs Panamanian Male Disability Correlation Chart
The statistical analysis conducted on geographies consisting of 237,879,390 people shows a weak positive correlation between the proportion of Immigrants from Netherlands and percentage of males with a disability in the United States with a correlation coefficient (R) of 0.227 and weighted average of 11.4%. Similarly, the statistical analysis conducted on geographies consisting of 281,191,975 people shows a mild positive correlation between the proportion of Panamanians and percentage of males with a disability in the United States with a correlation coefficient (R) of 0.385 and weighted average of 11.7%, a difference of 3.0%.
Male Disability Correlation Summary
| Measurement | Immigrants from Netherlands | Panamanian |
| Minimum | 6.9% | 6.3% |
| Maximum | 41.4% | 59.5% |
| Range | 34.5% | 53.2% |
| Mean | 14.2% | 17.3% |
| Median | 12.0% | 12.6% |
| Interquartile 25% (IQ1) | 9.8% | 10.5% |
| Interquartile 75% (IQ3) | 15.6% | 20.1% |
| Interquartile Range (IQR) | 5.8% | 9.6% |
| Standard Deviation (Sample) | 6.7% | 11.5% |
| Standard Deviation (Population) | 6.6% | 11.4% |
Similar Demographics by Male Disability
Demographics Similar to Immigrants from Netherlands by Male Disability
In terms of male disability, the demographic groups most similar to Immigrants from Netherlands are Immigrants from Bosnia and Herzegovina (11.4%, a difference of 0.040%), Estonian (11.4%, a difference of 0.060%), Immigrants from Austria (11.4%, a difference of 0.10%), Immigrants from Zaire (11.4%, a difference of 0.12%), and Senegalese (11.4%, a difference of 0.20%).
| Demographics | Rating | Rank | Male Disability |
| Immigrants | Belize | 33.7 /100 | #182 | Fair 11.3% |
| Immigrants | Central America | 32.9 /100 | #183 | Fair 11.3% |
| Iraqis | 30.5 /100 | #184 | Fair 11.3% |
| Pakistanis | 30.3 /100 | #185 | Fair 11.3% |
| Immigrants | Zaire | 27.6 /100 | #186 | Fair 11.4% |
| Immigrants | Austria | 27.3 /100 | #187 | Fair 11.4% |
| Estonians | 26.8 /100 | #188 | Fair 11.4% |
| Immigrants | Netherlands | 25.9 /100 | #189 | Fair 11.4% |
| Immigrants | Bosnia and Herzegovina | 25.4 /100 | #190 | Fair 11.4% |
| Senegalese | 23.2 /100 | #191 | Fair 11.4% |
| Assyrians/Chaldeans/Syriacs | 23.2 /100 | #192 | Fair 11.4% |
| Greeks | 22.2 /100 | #193 | Fair 11.4% |
| Belizeans | 21.2 /100 | #194 | Fair 11.4% |
| Immigrants | Oceania | 20.9 /100 | #195 | Fair 11.4% |
| West Indians | 18.4 /100 | #196 | Poor 11.4% |
Demographics Similar to Panamanians by Male Disability
In terms of male disability, the demographic groups most similar to Panamanians are Immigrants from Western Europe (11.7%, a difference of 0.010%), Immigrants from Congo (11.7%, a difference of 0.020%), Immigrants from England (11.7%, a difference of 0.060%), Alsatian (11.7%, a difference of 0.17%), and Immigrants from Bahamas (11.7%, a difference of 0.26%).
| Demographics | Rating | Rank | Male Disability |
| Immigrants | Scotland | 8.2 /100 | #212 | Tragic 11.6% |
| Mexican American Indians | 7.8 /100 | #213 | Tragic 11.6% |
| Lithuanians | 6.6 /100 | #214 | Tragic 11.6% |
| Indonesians | 5.9 /100 | #215 | Tragic 11.6% |
| Immigrants | Dominican Republic | 4.9 /100 | #216 | Tragic 11.7% |
| Immigrants | Dominica | 4.6 /100 | #217 | Tragic 11.7% |
| Immigrants | England | 4.0 /100 | #218 | Tragic 11.7% |
| Panamanians | 3.8 /100 | #219 | Tragic 11.7% |
| Immigrants | Western Europe | 3.8 /100 | #220 | Tragic 11.7% |
| Immigrants | Congo | 3.7 /100 | #221 | Tragic 11.7% |
| Alsatians | 3.3 /100 | #222 | Tragic 11.7% |
| Immigrants | Bahamas | 3.2 /100 | #223 | Tragic 11.7% |
| Japanese | 3.1 /100 | #224 | Tragic 11.7% |
| Liberians | 3.1 /100 | #225 | Tragic 11.8% |
| Sub-Saharan Africans | 2.8 /100 | #226 | Tragic 11.8% |