Immigrants from Cuba vs Panamanian Child Poverty Under the Age of 5
COMPARE
Immigrants from Cuba
Panamanian
Child Poverty Under the Age of 5
Child Poverty Under the Age of 5 Comparison
Immigrants from Cuba
Panamanians
19.9%
CHILD POVERTY UNDER THE AGE OF 5
0.2/ 100
METRIC RATING
255th/ 347
METRIC RANK
18.2%
CHILD POVERTY UNDER THE AGE OF 5
9.7/ 100
METRIC RATING
210th/ 347
METRIC RANK
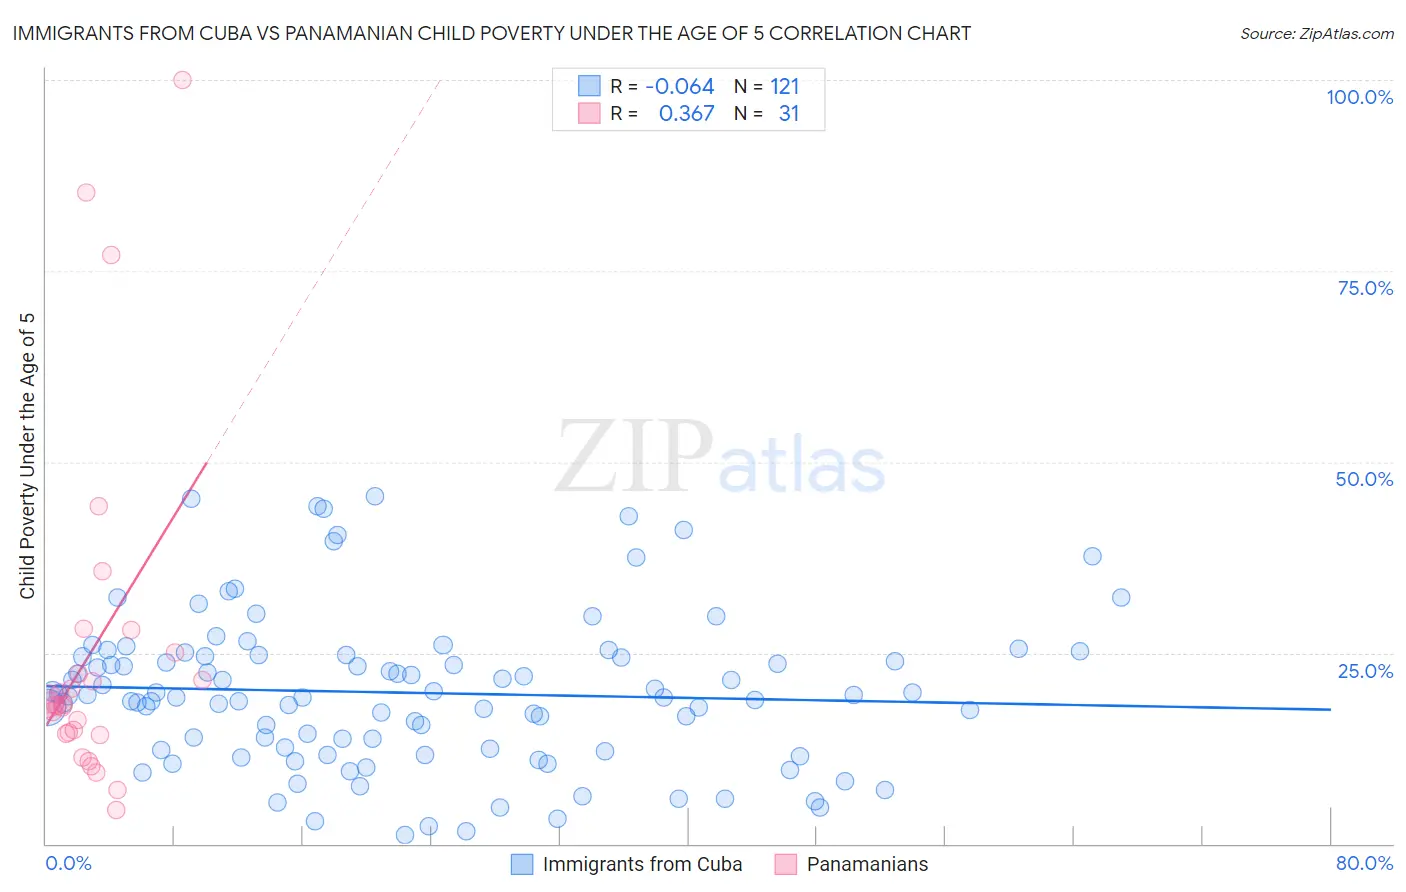
Immigrants from Cuba vs Panamanian Child Poverty Under the Age of 5 Correlation Chart
The statistical analysis conducted on geographies consisting of 316,135,095 people shows a slight negative correlation between the proportion of Immigrants from Cuba and poverty level among children under the age of 5 in the United States with a correlation coefficient (R) of -0.064 and weighted average of 19.9%. Similarly, the statistical analysis conducted on geographies consisting of 275,258,393 people shows a mild positive correlation between the proportion of Panamanians and poverty level among children under the age of 5 in the United States with a correlation coefficient (R) of 0.367 and weighted average of 18.2%, a difference of 9.3%.
Child Poverty Under the Age of 5 Correlation Summary
| Measurement | Immigrants from Cuba | Panamanian |
| Minimum | 1.1% | 4.3% |
| Maximum | 45.5% | 100.0% |
| Range | 44.3% | 95.7% |
| Mean | 19.8% | 25.2% |
| Median | 19.3% | 18.2% |
| Interquartile 25% (IQ1) | 12.3% | 14.4% |
| Interquartile 75% (IQ3) | 24.6% | 25.0% |
| Interquartile Range (IQR) | 12.3% | 10.6% |
| Standard Deviation (Sample) | 9.9% | 22.4% |
| Standard Deviation (Population) | 9.9% | 22.0% |
Similar Demographics by Child Poverty Under the Age of 5
Demographics Similar to Immigrants from Cuba by Child Poverty Under the Age of 5
In terms of child poverty under the age of 5, the demographic groups most similar to Immigrants from Cuba are Fijian (19.9%, a difference of 0.10%), Immigrants from Barbados (20.0%, a difference of 0.22%), Shoshone (20.0%, a difference of 0.23%), Mexican American Indian (19.9%, a difference of 0.25%), and Immigrants from St. Vincent and the Grenadines (20.0%, a difference of 0.37%).
| Demographics | Rating | Rank | Child Poverty Under the Age of 5 |
| Marshallese | 0.4 /100 | #248 | Tragic 19.7% |
| Immigrants | Middle Africa | 0.4 /100 | #249 | Tragic 19.7% |
| Immigrants | Nonimmigrants | 0.4 /100 | #250 | Tragic 19.7% |
| Pennsylvania Germans | 0.3 /100 | #251 | Tragic 19.8% |
| Immigrants | Nicaragua | 0.3 /100 | #252 | Tragic 19.8% |
| Mexican American Indians | 0.3 /100 | #253 | Tragic 19.9% |
| Fijians | 0.3 /100 | #254 | Tragic 19.9% |
| Immigrants | Cuba | 0.2 /100 | #255 | Tragic 19.9% |
| Immigrants | Barbados | 0.2 /100 | #256 | Tragic 20.0% |
| Shoshone | 0.2 /100 | #257 | Tragic 20.0% |
| Immigrants | St. Vincent and the Grenadines | 0.2 /100 | #258 | Tragic 20.0% |
| Immigrants | El Salvador | 0.2 /100 | #259 | Tragic 20.0% |
| Spanish Americans | 0.2 /100 | #260 | Tragic 20.1% |
| Immigrants | Bangladesh | 0.2 /100 | #261 | Tragic 20.1% |
| Liberians | 0.1 /100 | #262 | Tragic 20.2% |
Demographics Similar to Panamanians by Child Poverty Under the Age of 5
In terms of child poverty under the age of 5, the demographic groups most similar to Panamanians are Spanish (18.2%, a difference of 0.010%), Scotch-Irish (18.2%, a difference of 0.020%), Immigrants (18.2%, a difference of 0.030%), Moroccan (18.2%, a difference of 0.090%), and Nepalese (18.3%, a difference of 0.30%).
| Demographics | Rating | Rank | Child Poverty Under the Age of 5 |
| Immigrants | Cambodia | 13.7 /100 | #203 | Poor 18.1% |
| Immigrants | Eastern Africa | 13.4 /100 | #204 | Poor 18.1% |
| Spaniards | 12.8 /100 | #205 | Poor 18.1% |
| Whites/Caucasians | 12.6 /100 | #206 | Poor 18.1% |
| Immigrants | Immigrants | 9.9 /100 | #207 | Tragic 18.2% |
| Scotch-Irish | 9.8 /100 | #208 | Tragic 18.2% |
| Spanish | 9.8 /100 | #209 | Tragic 18.2% |
| Panamanians | 9.7 /100 | #210 | Tragic 18.2% |
| Moroccans | 9.4 /100 | #211 | Tragic 18.2% |
| Nepalese | 8.7 /100 | #212 | Tragic 18.3% |
| Immigrants | Thailand | 8.6 /100 | #213 | Tragic 18.3% |
| Malaysians | 6.5 /100 | #214 | Tragic 18.4% |
| Immigrants | Panama | 6.0 /100 | #215 | Tragic 18.5% |
| Hmong | 5.0 /100 | #216 | Tragic 18.5% |
| Immigrants | Africa | 4.6 /100 | #217 | Tragic 18.6% |