Immigrants from Netherlands vs Immigrants from Latvia Child Poverty Among Boys Under 16
COMPARE
Immigrants from Netherlands
Immigrants from Latvia
Child Poverty Among Boys Under 16
Child Poverty Among Boys Under 16 Comparison
Immigrants from Netherlands
Immigrants from Latvia
14.6%
CHILD POVERTY AMONG BOYS UNDER 16
98.1/ 100
METRIC RATING
71st/ 347
METRIC RANK
14.6%
CHILD POVERTY AMONG BOYS UNDER 16
98.1/ 100
METRIC RATING
72nd/ 347
METRIC RANK
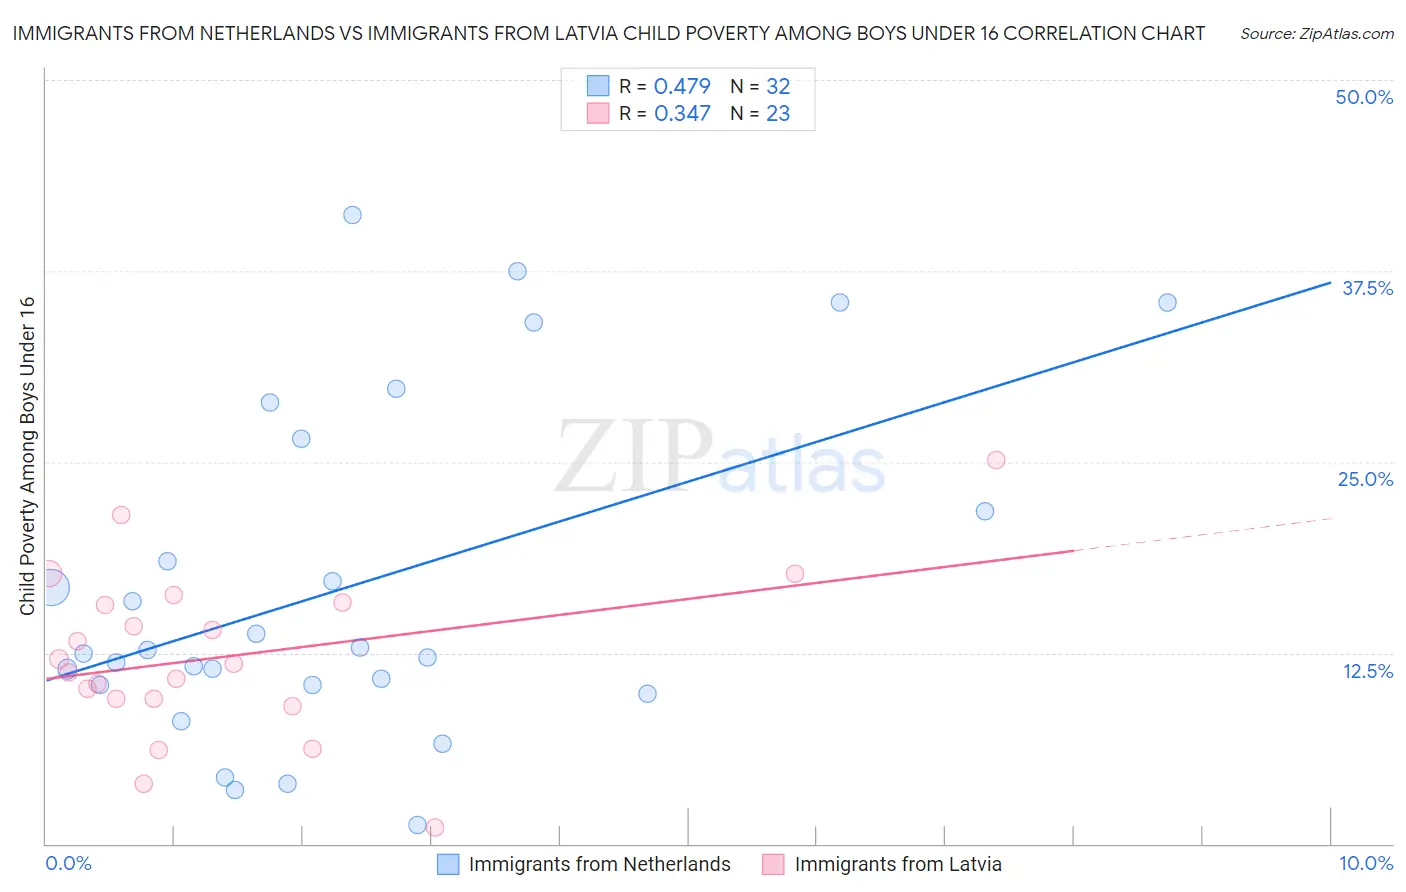
Immigrants from Netherlands vs Immigrants from Latvia Child Poverty Among Boys Under 16 Correlation Chart
The statistical analysis conducted on geographies consisting of 234,687,495 people shows a moderate positive correlation between the proportion of Immigrants from Netherlands and poverty level among boys under the age of 16 in the United States with a correlation coefficient (R) of 0.479 and weighted average of 14.6%. Similarly, the statistical analysis conducted on geographies consisting of 112,824,041 people shows a mild positive correlation between the proportion of Immigrants from Latvia and poverty level among boys under the age of 16 in the United States with a correlation coefficient (R) of 0.347 and weighted average of 14.6%, a difference of 0.010%.
Child Poverty Among Boys Under 16 Correlation Summary
| Measurement | Immigrants from Netherlands | Immigrants from Latvia |
| Minimum | 1.3% | 1.1% |
| Maximum | 41.1% | 25.1% |
| Range | 39.9% | 24.0% |
| Mean | 16.8% | 12.3% |
| Median | 12.5% | 11.8% |
| Interquartile 25% (IQ1) | 10.4% | 9.5% |
| Interquartile 75% (IQ3) | 24.1% | 15.8% |
| Interquartile Range (IQR) | 13.7% | 6.3% |
| Standard Deviation (Sample) | 11.0% | 5.5% |
| Standard Deviation (Population) | 10.8% | 5.4% |
Demographics Similar to Immigrants from Netherlands and Immigrants from Latvia by Child Poverty Among Boys Under 16
In terms of child poverty among boys under 16, the demographic groups most similar to Immigrants from Netherlands are Immigrants from Turkey (14.6%, a difference of 0.060%), Australian (14.7%, a difference of 0.11%), Immigrants from Poland (14.7%, a difference of 0.18%), Immigrants from Croatia (14.7%, a difference of 0.24%), and Macedonian (14.7%, a difference of 0.30%). Similarly, the demographic groups most similar to Immigrants from Latvia are Immigrants from Turkey (14.6%, a difference of 0.050%), Australian (14.7%, a difference of 0.10%), Immigrants from Poland (14.7%, a difference of 0.17%), Immigrants from Croatia (14.7%, a difference of 0.22%), and Macedonian (14.7%, a difference of 0.28%).
| Demographics | Rating | Rank | Child Poverty Among Boys Under 16 |
| Scandinavians | 98.8 /100 | #61 | Exceptional 14.4% |
| Immigrants | Israel | 98.7 /100 | #62 | Exceptional 14.4% |
| Cambodians | 98.5 /100 | #63 | Exceptional 14.5% |
| Immigrants | Romania | 98.5 /100 | #64 | Exceptional 14.5% |
| Soviet Union | 98.5 /100 | #65 | Exceptional 14.5% |
| Immigrants | Bulgaria | 98.5 /100 | #66 | Exceptional 14.5% |
| Immigrants | Europe | 98.4 /100 | #67 | Exceptional 14.5% |
| Slovenes | 98.4 /100 | #68 | Exceptional 14.5% |
| Immigrants | Austria | 98.4 /100 | #69 | Exceptional 14.5% |
| Europeans | 98.4 /100 | #70 | Exceptional 14.5% |
| Immigrants | Netherlands | 98.1 /100 | #71 | Exceptional 14.6% |
| Immigrants | Latvia | 98.1 /100 | #72 | Exceptional 14.6% |
| Immigrants | Turkey | 98.0 /100 | #73 | Exceptional 14.6% |
| Australians | 98.0 /100 | #74 | Exceptional 14.7% |
| Immigrants | Poland | 97.9 /100 | #75 | Exceptional 14.7% |
| Immigrants | Croatia | 97.9 /100 | #76 | Exceptional 14.7% |
| Macedonians | 97.9 /100 | #77 | Exceptional 14.7% |
| Egyptians | 97.8 /100 | #78 | Exceptional 14.7% |
| Immigrants | Eastern Europe | 97.8 /100 | #79 | Exceptional 14.7% |
| Immigrants | Russia | 97.7 /100 | #80 | Exceptional 14.7% |
| Immigrants | Canada | 97.6 /100 | #81 | Exceptional 14.7% |