Immigrants from Latin America vs Immigrants from Haiti Seniors Poverty Over the Age of 75
COMPARE
Immigrants from Latin America
Immigrants from Haiti
Seniors Poverty Over the Age of 75
Seniors Poverty Over the Age of 75 Comparison
Immigrants from Latin America
Immigrants from Haiti
15.6%
SENIORS POVERTY OVER THE AGE OF 75
0.0/ 100
METRIC RATING
301st/ 347
METRIC RANK
16.5%
SENIORS POVERTY OVER THE AGE OF 75
0.0/ 100
METRIC RATING
321st/ 347
METRIC RANK
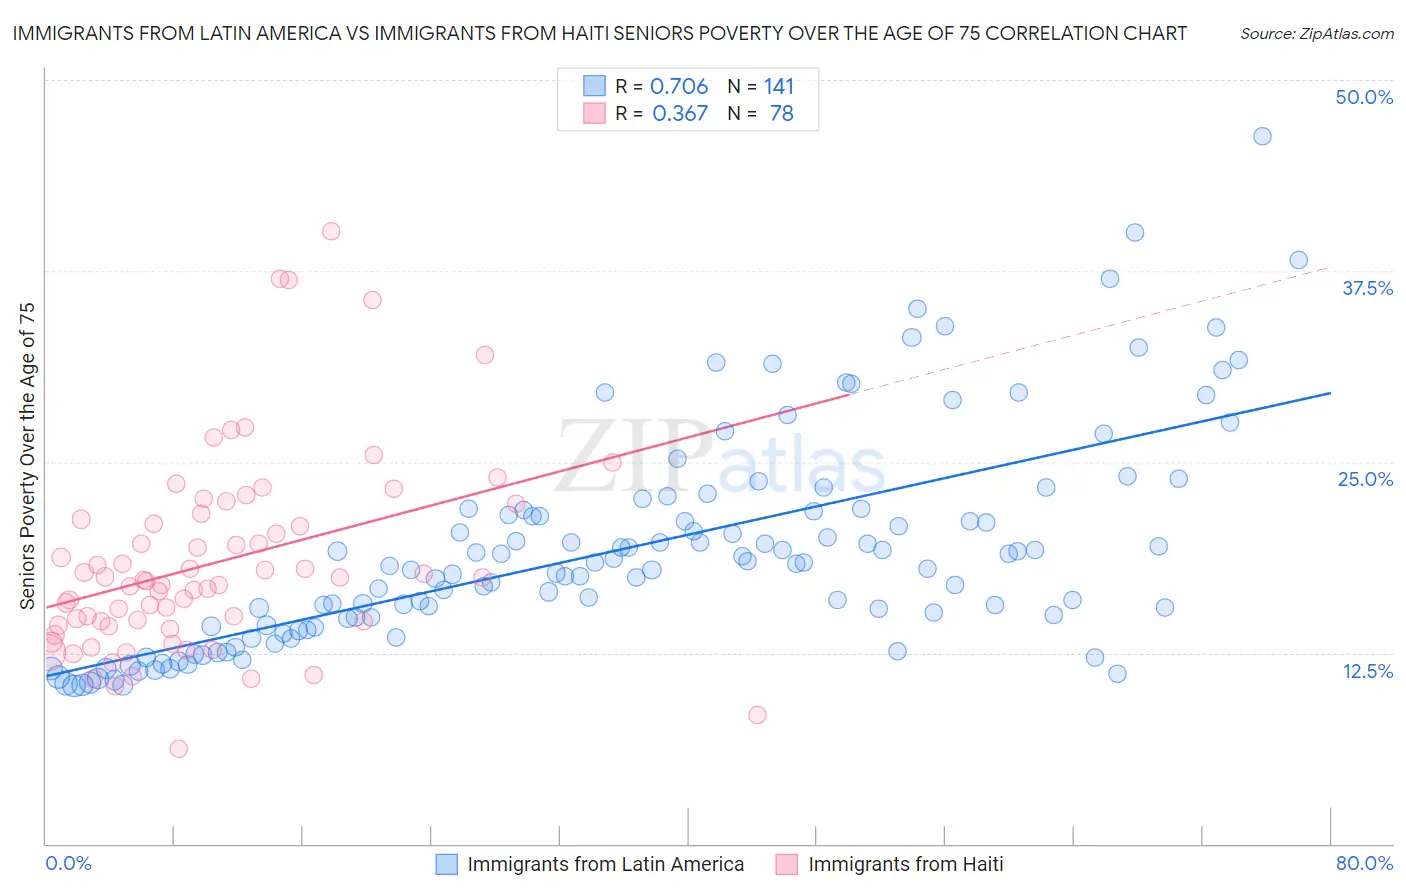
Immigrants from Latin America vs Immigrants from Haiti Seniors Poverty Over the Age of 75 Correlation Chart
The statistical analysis conducted on geographies consisting of 544,282,449 people shows a strong positive correlation between the proportion of Immigrants from Latin America and poverty level among seniors over the age of 75 in the United States with a correlation coefficient (R) of 0.706 and weighted average of 15.6%. Similarly, the statistical analysis conducted on geographies consisting of 223,608,368 people shows a mild positive correlation between the proportion of Immigrants from Haiti and poverty level among seniors over the age of 75 in the United States with a correlation coefficient (R) of 0.367 and weighted average of 16.5%, a difference of 5.7%.
Seniors Poverty Over the Age of 75 Correlation Summary
| Measurement | Immigrants from Latin America | Immigrants from Haiti |
| Minimum | 10.3% | 6.2% |
| Maximum | 46.3% | 40.1% |
| Range | 36.0% | 33.9% |
| Mean | 19.3% | 18.4% |
| Median | 18.2% | 17.2% |
| Interquartile 25% (IQ1) | 14.2% | 14.3% |
| Interquartile 75% (IQ3) | 21.8% | 21.2% |
| Interquartile Range (IQR) | 7.6% | 6.9% |
| Standard Deviation (Sample) | 7.0% | 6.5% |
| Standard Deviation (Population) | 7.0% | 6.4% |
Demographics Similar to Immigrants from Latin America and Immigrants from Haiti by Seniors Poverty Over the Age of 75
In terms of seniors poverty over the age of 75, the demographic groups most similar to Immigrants from Latin America are West Indian (15.7%, a difference of 0.31%), Immigrants from Honduras (15.7%, a difference of 0.48%), Immigrants from Trinidad and Tobago (15.7%, a difference of 0.66%), Ecuadorian (15.7%, a difference of 0.70%), and Hispanic or Latino (15.8%, a difference of 0.86%). Similarly, the demographic groups most similar to Immigrants from Haiti are Immigrants from Yemen (16.5%, a difference of 0.18%), Haitian (16.2%, a difference of 1.7%), Houma (16.2%, a difference of 1.7%), Immigrants from Guyana (16.2%, a difference of 1.8%), and Immigrants from Ecuador (16.1%, a difference of 2.5%).
| Demographics | Rating | Rank | Seniors Poverty Over the Age of 75 |
| Immigrants | Latin America | 0.0 /100 | #301 | Tragic 15.6% |
| West Indians | 0.0 /100 | #302 | Tragic 15.7% |
| Immigrants | Honduras | 0.0 /100 | #303 | Tragic 15.7% |
| Immigrants | Trinidad and Tobago | 0.0 /100 | #304 | Tragic 15.7% |
| Ecuadorians | 0.0 /100 | #305 | Tragic 15.7% |
| Hispanics or Latinos | 0.0 /100 | #306 | Tragic 15.8% |
| Immigrants | West Indies | 0.0 /100 | #307 | Tragic 15.8% |
| Immigrants | Bangladesh | 0.0 /100 | #308 | Tragic 15.8% |
| Yup'ik | 0.0 /100 | #309 | Tragic 15.8% |
| Vietnamese | 0.0 /100 | #310 | Tragic 15.9% |
| Trinidadians and Tobagonians | 0.0 /100 | #311 | Tragic 15.9% |
| Crow | 0.0 /100 | #312 | Tragic 15.9% |
| Barbadians | 0.0 /100 | #313 | Tragic 16.0% |
| Tsimshian | 0.0 /100 | #314 | Tragic 16.1% |
| Guyanese | 0.0 /100 | #315 | Tragic 16.1% |
| Immigrants | Ecuador | 0.0 /100 | #316 | Tragic 16.1% |
| Immigrants | Guyana | 0.0 /100 | #317 | Tragic 16.2% |
| Houma | 0.0 /100 | #318 | Tragic 16.2% |
| Haitians | 0.0 /100 | #319 | Tragic 16.2% |
| Immigrants | Yemen | 0.0 /100 | #320 | Tragic 16.5% |
| Immigrants | Haiti | 0.0 /100 | #321 | Tragic 16.5% |