Immigrants from Nepal vs Mexican Seniors Poverty Over the Age of 75
COMPARE
Immigrants from Nepal
Mexican
Seniors Poverty Over the Age of 75
Seniors Poverty Over the Age of 75 Comparison
Immigrants from Nepal
Mexicans
11.8%
SENIORS POVERTY OVER THE AGE OF 75
84.5/ 100
METRIC RATING
120th/ 347
METRIC RANK
14.4%
SENIORS POVERTY OVER THE AGE OF 75
0.0/ 100
METRIC RATING
272nd/ 347
METRIC RANK
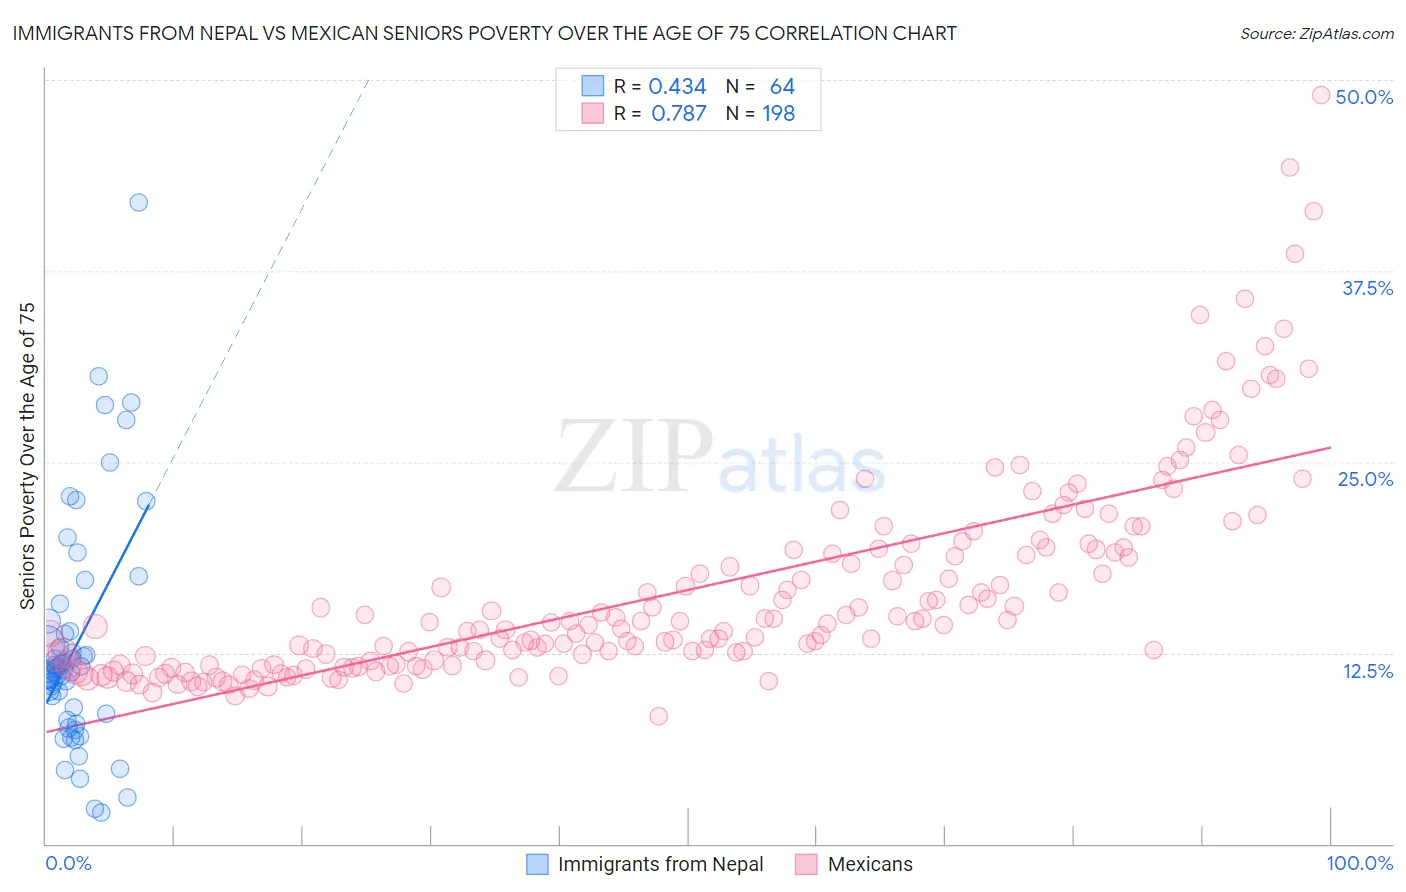
Immigrants from Nepal vs Mexican Seniors Poverty Over the Age of 75 Correlation Chart
The statistical analysis conducted on geographies consisting of 185,282,037 people shows a moderate positive correlation between the proportion of Immigrants from Nepal and poverty level among seniors over the age of 75 in the United States with a correlation coefficient (R) of 0.434 and weighted average of 11.8%. Similarly, the statistical analysis conducted on geographies consisting of 549,837,754 people shows a strong positive correlation between the proportion of Mexicans and poverty level among seniors over the age of 75 in the United States with a correlation coefficient (R) of 0.787 and weighted average of 14.4%, a difference of 22.2%.
Seniors Poverty Over the Age of 75 Correlation Summary
| Measurement | Immigrants from Nepal | Mexican |
| Minimum | 2.1% | 8.4% |
| Maximum | 42.0% | 49.0% |
| Range | 39.9% | 40.7% |
| Mean | 12.9% | 16.5% |
| Median | 11.4% | 14.3% |
| Interquartile 25% (IQ1) | 8.7% | 11.7% |
| Interquartile 75% (IQ3) | 13.8% | 19.3% |
| Interquartile Range (IQR) | 5.1% | 7.5% |
| Standard Deviation (Sample) | 7.4% | 6.8% |
| Standard Deviation (Population) | 7.3% | 6.8% |
Similar Demographics by Seniors Poverty Over the Age of 75
Demographics Similar to Immigrants from Nepal by Seniors Poverty Over the Age of 75
In terms of seniors poverty over the age of 75, the demographic groups most similar to Immigrants from Nepal are Immigrants from Uganda (11.8%, a difference of 0.040%), Malaysian (11.8%, a difference of 0.080%), Pakistani (11.8%, a difference of 0.080%), Immigrants from Italy (11.8%, a difference of 0.090%), and Fijian (11.8%, a difference of 0.12%).
| Demographics | Rating | Rank | Seniors Poverty Over the Age of 75 |
| Immigrants | Czechoslovakia | 87.0 /100 | #113 | Excellent 11.7% |
| Ukrainians | 86.9 /100 | #114 | Excellent 11.7% |
| New Zealanders | 86.3 /100 | #115 | Excellent 11.7% |
| Iraqis | 86.3 /100 | #116 | Excellent 11.7% |
| Icelanders | 85.7 /100 | #117 | Excellent 11.7% |
| Immigrants | Zimbabwe | 85.5 /100 | #118 | Excellent 11.7% |
| Immigrants | Uganda | 84.8 /100 | #119 | Excellent 11.8% |
| Immigrants | Nepal | 84.5 /100 | #120 | Excellent 11.8% |
| Malaysians | 84.1 /100 | #121 | Excellent 11.8% |
| Pakistanis | 84.0 /100 | #122 | Excellent 11.8% |
| Immigrants | Italy | 84.0 /100 | #123 | Excellent 11.8% |
| Fijians | 83.8 /100 | #124 | Excellent 11.8% |
| Sudanese | 83.6 /100 | #125 | Excellent 11.8% |
| Pennsylvania Germans | 83.4 /100 | #126 | Excellent 11.8% |
| Immigrants | Denmark | 82.6 /100 | #127 | Excellent 11.8% |
Demographics Similar to Mexicans by Seniors Poverty Over the Age of 75
In terms of seniors poverty over the age of 75, the demographic groups most similar to Mexicans are Immigrants from Ghana (14.4%, a difference of 0.11%), Immigrants from South America (14.4%, a difference of 0.22%), Immigrants from Bahamas (14.4%, a difference of 0.39%), Immigrants from El Salvador (14.5%, a difference of 0.55%), and Immigrants from Uruguay (14.3%, a difference of 0.59%).
| Demographics | Rating | Rank | Seniors Poverty Over the Age of 75 |
| Salvadorans | 0.0 /100 | #265 | Tragic 14.2% |
| Armenians | 0.0 /100 | #266 | Tragic 14.2% |
| Venezuelans | 0.0 /100 | #267 | Tragic 14.2% |
| Colombians | 0.0 /100 | #268 | Tragic 14.3% |
| Immigrants | Venezuela | 0.0 /100 | #269 | Tragic 14.3% |
| Immigrants | Uruguay | 0.0 /100 | #270 | Tragic 14.3% |
| Immigrants | Ghana | 0.0 /100 | #271 | Tragic 14.4% |
| Mexicans | 0.0 /100 | #272 | Tragic 14.4% |
| Immigrants | South America | 0.0 /100 | #273 | Tragic 14.4% |
| Immigrants | Bahamas | 0.0 /100 | #274 | Tragic 14.4% |
| Immigrants | El Salvador | 0.0 /100 | #275 | Tragic 14.5% |
| Soviet Union | 0.0 /100 | #276 | Tragic 14.5% |
| Senegalese | 0.0 /100 | #277 | Tragic 14.5% |
| Immigrants | Colombia | 0.0 /100 | #278 | Tragic 14.6% |
| Blacks/African Americans | 0.0 /100 | #279 | Tragic 14.6% |