Immigrants from Kazakhstan vs Guatemalan Female Poverty Among 25-34 Year Olds
COMPARE
Immigrants from Kazakhstan
Guatemalan
Female Poverty Among 25-34 Year Olds
Female Poverty Among 25-34 Year Olds Comparison
Immigrants from Kazakhstan
Guatemalans
12.4%
FEMALE POVERTY AMONG 25-34 YEAR OLDS
98.1/ 100
METRIC RATING
81st/ 347
METRIC RANK
16.4%
FEMALE POVERTY AMONG 25-34 YEAR OLDS
0.0/ 100
METRIC RATING
288th/ 347
METRIC RANK
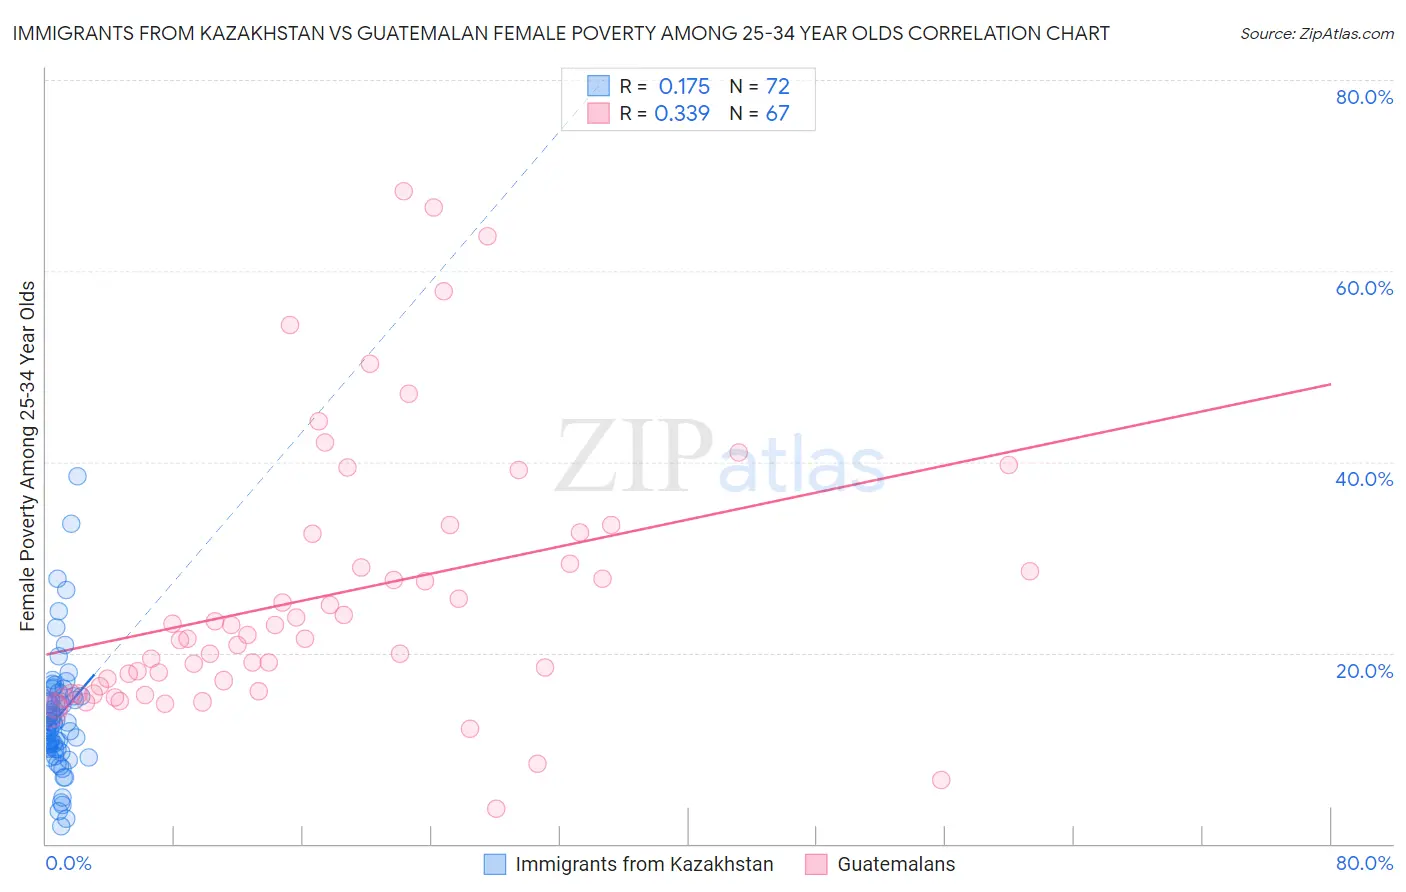
Immigrants from Kazakhstan vs Guatemalan Female Poverty Among 25-34 Year Olds Correlation Chart
The statistical analysis conducted on geographies consisting of 123,655,702 people shows a poor positive correlation between the proportion of Immigrants from Kazakhstan and poverty level among females between the ages 25 and 34 in the United States with a correlation coefficient (R) of 0.175 and weighted average of 12.4%. Similarly, the statistical analysis conducted on geographies consisting of 404,378,710 people shows a mild positive correlation between the proportion of Guatemalans and poverty level among females between the ages 25 and 34 in the United States with a correlation coefficient (R) of 0.339 and weighted average of 16.4%, a difference of 31.9%.
Female Poverty Among 25-34 Year Olds Correlation Summary
| Measurement | Immigrants from Kazakhstan | Guatemalan |
| Minimum | 1.8% | 3.7% |
| Maximum | 38.5% | 68.3% |
| Range | 36.6% | 64.6% |
| Mean | 13.3% | 26.0% |
| Median | 12.7% | 21.5% |
| Interquartile 25% (IQ1) | 10.0% | 15.9% |
| Interquartile 75% (IQ3) | 15.5% | 32.4% |
| Interquartile Range (IQR) | 5.5% | 16.5% |
| Standard Deviation (Sample) | 6.3% | 14.1% |
| Standard Deviation (Population) | 6.3% | 14.0% |
Similar Demographics by Female Poverty Among 25-34 Year Olds
Demographics Similar to Immigrants from Kazakhstan by Female Poverty Among 25-34 Year Olds
In terms of female poverty among 25-34 year olds, the demographic groups most similar to Immigrants from Kazakhstan are Ethiopian (12.4%, a difference of 0.080%), Immigrants from Malaysia (12.4%, a difference of 0.24%), Albanian (12.5%, a difference of 0.40%), Immigrants from Latvia (12.5%, a difference of 0.46%), and Immigrants from Jordan (12.4%, a difference of 0.51%).
| Demographics | Rating | Rank | Female Poverty Among 25-34 Year Olds |
| Immigrants | Sweden | 98.9 /100 | #74 | Exceptional 12.3% |
| Estonians | 98.9 /100 | #75 | Exceptional 12.3% |
| Greeks | 98.9 /100 | #76 | Exceptional 12.3% |
| Immigrants | Italy | 98.8 /100 | #77 | Exceptional 12.3% |
| Immigrants | Ukraine | 98.6 /100 | #78 | Exceptional 12.3% |
| Immigrants | Jordan | 98.5 /100 | #79 | Exceptional 12.4% |
| Immigrants | Malaysia | 98.3 /100 | #80 | Exceptional 12.4% |
| Immigrants | Kazakhstan | 98.1 /100 | #81 | Exceptional 12.4% |
| Ethiopians | 98.0 /100 | #82 | Exceptional 12.4% |
| Albanians | 97.7 /100 | #83 | Exceptional 12.5% |
| Immigrants | Latvia | 97.7 /100 | #84 | Exceptional 12.5% |
| Immigrants | South Eastern Asia | 97.6 /100 | #85 | Exceptional 12.5% |
| Croatians | 97.5 /100 | #86 | Exceptional 12.5% |
| Argentineans | 97.5 /100 | #87 | Exceptional 12.5% |
| Immigrants | Austria | 97.4 /100 | #88 | Exceptional 12.5% |
Demographics Similar to Guatemalans by Female Poverty Among 25-34 Year Olds
In terms of female poverty among 25-34 year olds, the demographic groups most similar to Guatemalans are Osage (16.4%, a difference of 0.060%), American (16.4%, a difference of 0.19%), Indonesian (16.4%, a difference of 0.22%), Cape Verdean (16.3%, a difference of 0.24%), and Immigrants from Bahamas (16.3%, a difference of 0.42%).
| Demographics | Rating | Rank | Female Poverty Among 25-34 Year Olds |
| Immigrants | Latin America | 0.0 /100 | #281 | Tragic 16.0% |
| Aleuts | 0.0 /100 | #282 | Tragic 16.1% |
| Bahamians | 0.0 /100 | #283 | Tragic 16.1% |
| Shoshone | 0.0 /100 | #284 | Tragic 16.2% |
| Immigrants | Bahamas | 0.0 /100 | #285 | Tragic 16.3% |
| Cape Verdeans | 0.0 /100 | #286 | Tragic 16.3% |
| Americans | 0.0 /100 | #287 | Tragic 16.4% |
| Guatemalans | 0.0 /100 | #288 | Tragic 16.4% |
| Osage | 0.0 /100 | #289 | Tragic 16.4% |
| Indonesians | 0.0 /100 | #290 | Tragic 16.4% |
| Comanche | 0.0 /100 | #291 | Tragic 16.5% |
| Immigrants | Dominica | 0.0 /100 | #292 | Tragic 16.5% |
| Potawatomi | 0.0 /100 | #293 | Tragic 16.5% |
| Immigrants | Central America | 0.0 /100 | #294 | Tragic 16.6% |
| Mexicans | 0.0 /100 | #295 | Tragic 16.6% |