Immigrants from Nepal vs French Canadian Average Family Size
COMPARE
Immigrants from Nepal
French Canadian
Average Family Size
Average Family Size Comparison
Immigrants from Nepal
French Canadians
3.21
AVERAGE FAMILY SIZE
18.1/ 100
METRIC RATING
203rd/ 347
METRIC RANK
3.07
AVERAGE FAMILY SIZE
0.0/ 100
METRIC RATING
344th/ 347
METRIC RANK
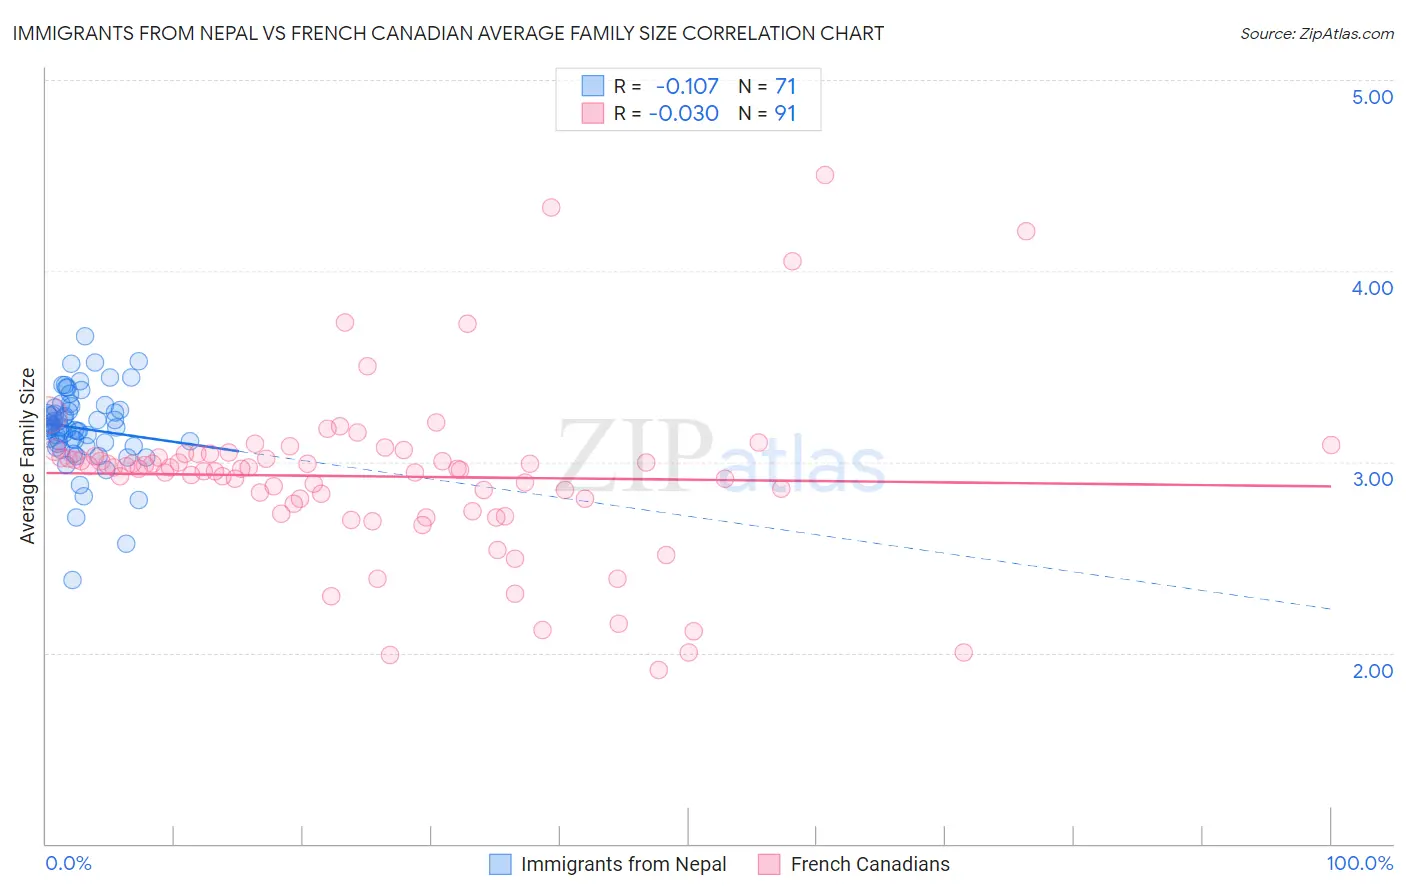
Immigrants from Nepal vs French Canadian Average Family Size Correlation Chart
The statistical analysis conducted on geographies consisting of 186,665,841 people shows a poor negative correlation between the proportion of Immigrants from Nepal and average family size in the United States with a correlation coefficient (R) of -0.107 and weighted average of 3.21. Similarly, the statistical analysis conducted on geographies consisting of 502,268,768 people shows no correlation between the proportion of French Canadians and average family size in the United States with a correlation coefficient (R) of -0.030 and weighted average of 3.07, a difference of 4.3%.
Average Family Size Correlation Summary
| Measurement | Immigrants from Nepal | French Canadian |
| Minimum | 2.38 | 1.91 |
| Maximum | 3.66 | 4.50 |
| Range | 1.28 | 2.59 |
| Mean | 3.18 | 2.92 |
| Median | 3.18 | 2.97 |
| Interquartile 25% (IQ1) | 3.09 | 2.78 |
| Interquartile 75% (IQ3) | 3.29 | 3.04 |
| Interquartile Range (IQR) | 0.19 | 0.26 |
| Standard Deviation (Sample) | 0.21 | 0.44 |
| Standard Deviation (Population) | 0.21 | 0.44 |
Similar Demographics by Average Family Size
Demographics Similar to Immigrants from Nepal by Average Family Size
In terms of average family size, the demographic groups most similar to Immigrants from Nepal are Immigrants from Morocco (3.21, a difference of 0.010%), Immigrants from India (3.21, a difference of 0.010%), Immigrants from Kenya (3.21, a difference of 0.030%), Immigrants from Poland (3.20, a difference of 0.050%), and Paraguayan (3.20, a difference of 0.060%).
| Demographics | Rating | Rank | Average Family Size |
| Senegalese | 28.2 /100 | #196 | Fair 3.21 |
| Kenyans | 28.0 /100 | #197 | Fair 3.21 |
| Immigrants | Azores | 21.7 /100 | #198 | Fair 3.21 |
| Hmong | 20.7 /100 | #199 | Fair 3.21 |
| Immigrants | Kenya | 19.2 /100 | #200 | Poor 3.21 |
| Immigrants | Morocco | 18.5 /100 | #201 | Poor 3.21 |
| Immigrants | India | 18.5 /100 | #202 | Poor 3.21 |
| Immigrants | Nepal | 18.1 /100 | #203 | Poor 3.21 |
| Immigrants | Poland | 16.6 /100 | #204 | Poor 3.20 |
| Paraguayans | 16.3 /100 | #205 | Poor 3.20 |
| Immigrants | Cabo Verde | 16.0 /100 | #206 | Poor 3.20 |
| Filipinos | 13.6 /100 | #207 | Poor 3.20 |
| Chippewa | 13.3 /100 | #208 | Poor 3.20 |
| Sudanese | 13.3 /100 | #209 | Poor 3.20 |
| Zimbabweans | 12.6 /100 | #210 | Poor 3.20 |
Demographics Similar to French Canadians by Average Family Size
In terms of average family size, the demographic groups most similar to French Canadians are Slovene (3.07, a difference of 0.040%), Norwegian (3.08, a difference of 0.24%), Slovak (3.06, a difference of 0.33%), Carpatho Rusyn (3.06, a difference of 0.39%), and German (3.09, a difference of 0.47%).
| Demographics | Rating | Rank | Average Family Size |
| Estonians | 0.0 /100 | #333 | Tragic 3.10 |
| Lithuanians | 0.0 /100 | #334 | Tragic 3.10 |
| Luxembourgers | 0.0 /100 | #335 | Tragic 3.10 |
| Irish | 0.0 /100 | #336 | Tragic 3.10 |
| Swedes | 0.0 /100 | #337 | Tragic 3.10 |
| French | 0.0 /100 | #338 | Tragic 3.10 |
| Croatians | 0.0 /100 | #339 | Tragic 3.10 |
| Finns | 0.0 /100 | #340 | Tragic 3.09 |
| Poles | 0.0 /100 | #341 | Tragic 3.09 |
| Germans | 0.0 /100 | #342 | Tragic 3.09 |
| Norwegians | 0.0 /100 | #343 | Tragic 3.08 |
| French Canadians | 0.0 /100 | #344 | Tragic 3.07 |
| Slovenes | 0.0 /100 | #345 | Tragic 3.07 |
| Slovaks | 0.0 /100 | #346 | Tragic 3.06 |
| Carpatho Rusyns | 0.0 /100 | #347 | Tragic 3.06 |