Immigrants from Micronesia vs Immigrants from Central America Child Poverty Among Boys Under 16
COMPARE
Immigrants from Micronesia
Immigrants from Central America
Child Poverty Among Boys Under 16
Child Poverty Among Boys Under 16 Comparison
Immigrants from Micronesia
Immigrants from Central America
18.3%
CHILD POVERTY AMONG BOYS UNDER 16
1.8/ 100
METRIC RATING
229th/ 347
METRIC RANK
21.3%
CHILD POVERTY AMONG BOYS UNDER 16
0.0/ 100
METRIC RATING
304th/ 347
METRIC RANK
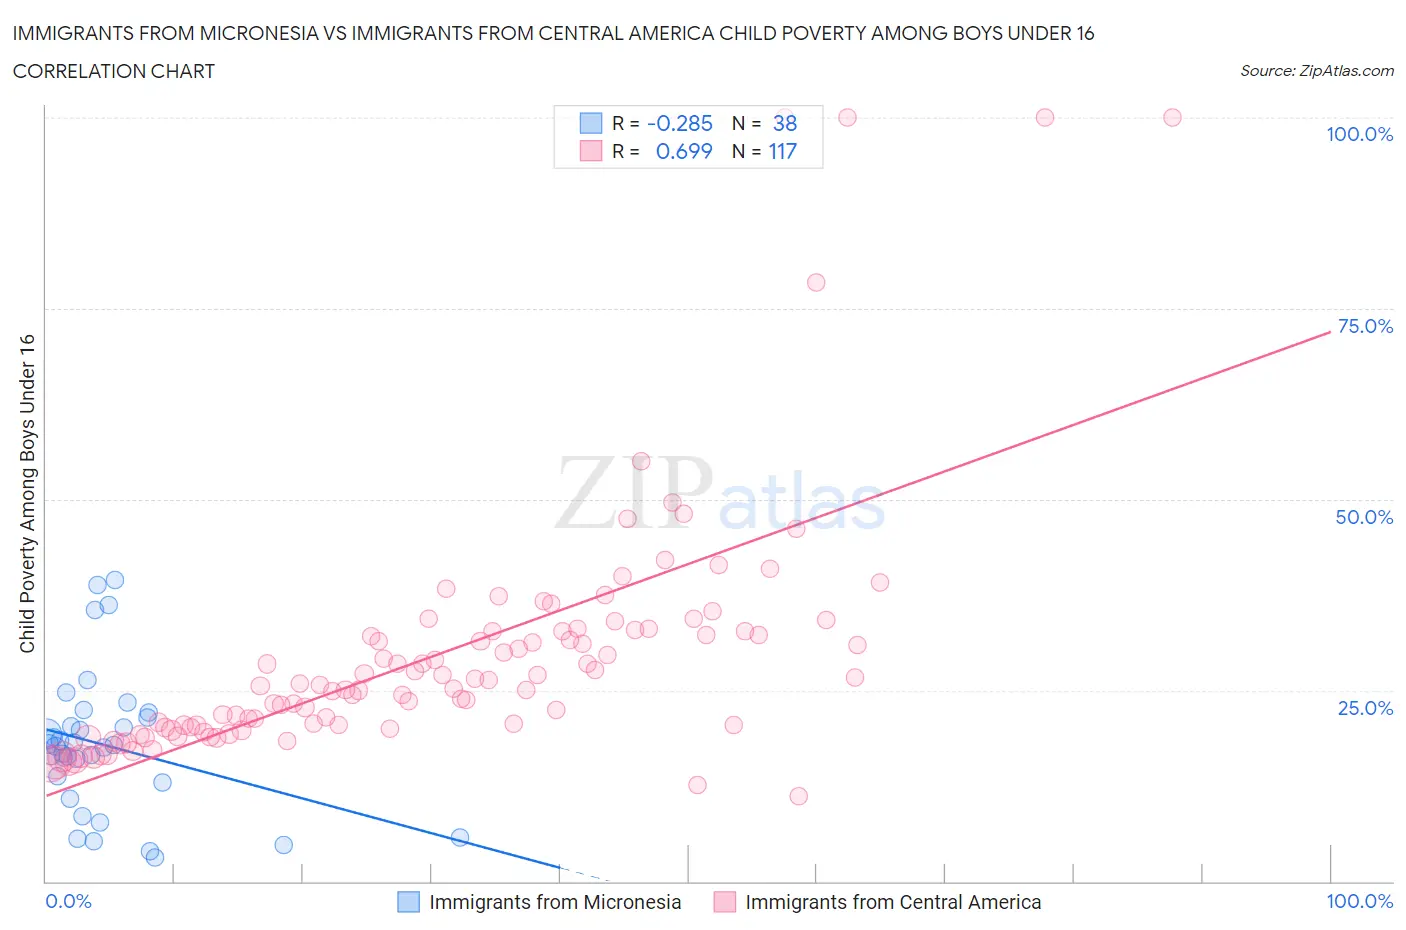
Immigrants from Micronesia vs Immigrants from Central America Child Poverty Among Boys Under 16 Correlation Chart
The statistical analysis conducted on geographies consisting of 61,480,670 people shows a weak negative correlation between the proportion of Immigrants from Micronesia and poverty level among boys under the age of 16 in the United States with a correlation coefficient (R) of -0.285 and weighted average of 18.3%. Similarly, the statistical analysis conducted on geographies consisting of 522,928,999 people shows a significant positive correlation between the proportion of Immigrants from Central America and poverty level among boys under the age of 16 in the United States with a correlation coefficient (R) of 0.699 and weighted average of 21.3%, a difference of 16.4%.
Child Poverty Among Boys Under 16 Correlation Summary
| Measurement | Immigrants from Micronesia | Immigrants from Central America |
| Minimum | 3.0% | 11.1% |
| Maximum | 39.5% | 100.0% |
| Range | 36.4% | 88.9% |
| Mean | 17.8% | 29.6% |
| Median | 17.8% | 25.7% |
| Interquartile 25% (IQ1) | 12.9% | 20.1% |
| Interquartile 75% (IQ3) | 21.5% | 32.7% |
| Interquartile Range (IQR) | 8.6% | 12.6% |
| Standard Deviation (Sample) | 9.2% | 16.4% |
| Standard Deviation (Population) | 9.1% | 16.4% |
Similar Demographics by Child Poverty Among Boys Under 16
Demographics Similar to Immigrants from Micronesia by Child Poverty Among Boys Under 16
In terms of child poverty among boys under 16, the demographic groups most similar to Immigrants from Micronesia are Fijian (18.3%, a difference of 0.0%), Nonimmigrants (18.2%, a difference of 0.52%), Nicaraguan (18.4%, a difference of 0.53%), Marshallese (18.4%, a difference of 0.73%), and Bermudan (18.1%, a difference of 0.85%).
| Demographics | Rating | Rank | Child Poverty Among Boys Under 16 |
| Pennsylvania Germans | 3.9 /100 | #222 | Tragic 17.9% |
| Cubans | 3.8 /100 | #223 | Tragic 17.9% |
| Nepalese | 3.2 /100 | #224 | Tragic 18.0% |
| Inupiat | 2.7 /100 | #225 | Tragic 18.1% |
| Immigrants | Africa | 2.6 /100 | #226 | Tragic 18.1% |
| Bermudans | 2.5 /100 | #227 | Tragic 18.1% |
| Immigrants | Nonimmigrants | 2.2 /100 | #228 | Tragic 18.2% |
| Immigrants | Micronesia | 1.8 /100 | #229 | Tragic 18.3% |
| Fijians | 1.8 /100 | #230 | Tragic 18.3% |
| Nicaraguans | 1.4 /100 | #231 | Tragic 18.4% |
| Marshallese | 1.3 /100 | #232 | Tragic 18.4% |
| Immigrants | Nigeria | 1.2 /100 | #233 | Tragic 18.4% |
| Nigerians | 1.1 /100 | #234 | Tragic 18.5% |
| Americans | 0.9 /100 | #235 | Tragic 18.6% |
| Sudanese | 0.9 /100 | #236 | Tragic 18.6% |
Demographics Similar to Immigrants from Central America by Child Poverty Among Boys Under 16
In terms of child poverty among boys under 16, the demographic groups most similar to Immigrants from Central America are Immigrants from Haiti (21.3%, a difference of 0.060%), Kiowa (21.3%, a difference of 0.17%), Immigrants from Grenada (21.3%, a difference of 0.18%), Choctaw (21.3%, a difference of 0.27%), and Somali (21.1%, a difference of 0.59%).
| Demographics | Rating | Rank | Child Poverty Among Boys Under 16 |
| Hispanics or Latinos | 0.0 /100 | #297 | Tragic 20.9% |
| Chippewa | 0.0 /100 | #298 | Tragic 21.0% |
| Immigrants | Caribbean | 0.0 /100 | #299 | Tragic 21.0% |
| Haitians | 0.0 /100 | #300 | Tragic 21.0% |
| Guatemalans | 0.0 /100 | #301 | Tragic 21.1% |
| Somalis | 0.0 /100 | #302 | Tragic 21.1% |
| Immigrants | Haiti | 0.0 /100 | #303 | Tragic 21.3% |
| Immigrants | Central America | 0.0 /100 | #304 | Tragic 21.3% |
| Kiowa | 0.0 /100 | #305 | Tragic 21.3% |
| Immigrants | Grenada | 0.0 /100 | #306 | Tragic 21.3% |
| Choctaw | 0.0 /100 | #307 | Tragic 21.3% |
| Immigrants | Mexico | 0.0 /100 | #308 | Tragic 21.5% |
| Seminole | 0.0 /100 | #309 | Tragic 21.5% |
| Creek | 0.0 /100 | #310 | Tragic 21.5% |
| Bahamians | 0.0 /100 | #311 | Tragic 21.6% |