Immigrants from Moldova vs Immigrants Single Mother Households
COMPARE
Immigrants from Moldova
Immigrants
Single Mother Households
Single Mother Households Comparison
Immigrants from Moldova
Immigrants
5.6%
SINGLE MOTHER HOUSEHOLDS
97.9/ 100
METRIC RATING
81st/ 347
METRIC RANK
6.8%
SINGLE MOTHER HOUSEHOLDS
4.3/ 100
METRIC RATING
219th/ 347
METRIC RANK
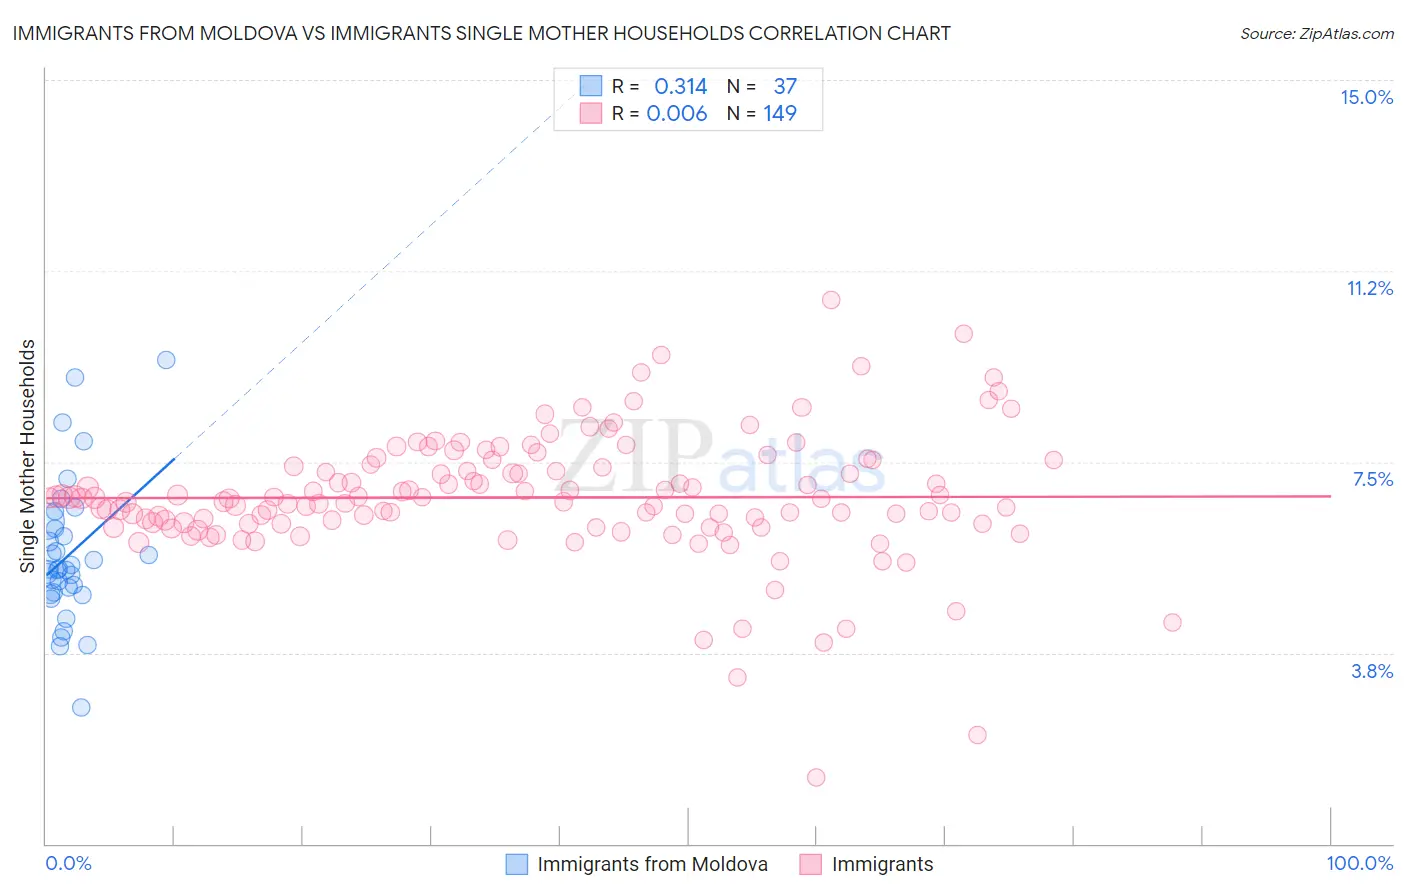
Immigrants from Moldova vs Immigrants Single Mother Households Correlation Chart
The statistical analysis conducted on geographies consisting of 124,294,773 people shows a mild positive correlation between the proportion of Immigrants from Moldova and percentage of single mother households in the United States with a correlation coefficient (R) of 0.314 and weighted average of 5.6%. Similarly, the statistical analysis conducted on geographies consisting of 572,041,298 people shows no correlation between the proportion of Immigrants and percentage of single mother households in the United States with a correlation coefficient (R) of 0.006 and weighted average of 6.8%, a difference of 21.3%.
Single Mother Households Correlation Summary
| Measurement | Immigrants from Moldova | Immigrants |
| Minimum | 2.7% | 1.3% |
| Maximum | 9.5% | 10.7% |
| Range | 6.8% | 9.4% |
| Mean | 5.7% | 6.8% |
| Median | 5.4% | 6.8% |
| Interquartile 25% (IQ1) | 4.9% | 6.3% |
| Interquartile 75% (IQ3) | 6.3% | 7.4% |
| Interquartile Range (IQR) | 1.3% | 1.1% |
| Standard Deviation (Sample) | 1.4% | 1.3% |
| Standard Deviation (Population) | 1.4% | 1.3% |
Similar Demographics by Single Mother Households
Demographics Similar to Immigrants from Moldova by Single Mother Households
In terms of single mother households, the demographic groups most similar to Immigrants from Moldova are Czech (5.6%, a difference of 0.0%), Immigrants from Sri Lanka (5.6%, a difference of 0.11%), Immigrants from Malaysia (5.7%, a difference of 0.21%), Immigrants from Hungary (5.7%, a difference of 0.24%), and Swiss (5.6%, a difference of 0.31%).
| Demographics | Rating | Rank | Single Mother Households |
| Immigrants | North America | 98.3 /100 | #74 | Exceptional 5.6% |
| Slovenes | 98.3 /100 | #75 | Exceptional 5.6% |
| New Zealanders | 98.2 /100 | #76 | Exceptional 5.6% |
| Romanians | 98.1 /100 | #77 | Exceptional 5.6% |
| Swiss | 98.1 /100 | #78 | Exceptional 5.6% |
| Immigrants | Sri Lanka | 98.0 /100 | #79 | Exceptional 5.6% |
| Czechs | 97.9 /100 | #80 | Exceptional 5.6% |
| Immigrants | Moldova | 97.9 /100 | #81 | Exceptional 5.6% |
| Immigrants | Malaysia | 97.8 /100 | #82 | Exceptional 5.7% |
| Immigrants | Hungary | 97.8 /100 | #83 | Exceptional 5.7% |
| Carpatho Rusyns | 97.7 /100 | #84 | Exceptional 5.7% |
| Hungarians | 97.6 /100 | #85 | Exceptional 5.7% |
| Finns | 97.6 /100 | #86 | Exceptional 5.7% |
| Immigrants | Turkey | 97.5 /100 | #87 | Exceptional 5.7% |
| Israelis | 97.4 /100 | #88 | Exceptional 5.7% |
Demographics Similar to Immigrants by Single Mother Households
In terms of single mother households, the demographic groups most similar to Immigrants are Immigrants from Eastern Africa (6.8%, a difference of 0.090%), Immigrants from Thailand (6.9%, a difference of 0.18%), Aleut (6.8%, a difference of 0.30%), French American Indian (6.9%, a difference of 0.38%), and Immigrants from Bangladesh (6.9%, a difference of 0.40%).
| Demographics | Rating | Rank | Single Mother Households |
| Immigrants | Eritrea | 8.4 /100 | #212 | Tragic 6.7% |
| Immigrants | Costa Rica | 8.2 /100 | #213 | Tragic 6.7% |
| Immigrants | Uruguay | 7.9 /100 | #214 | Tragic 6.7% |
| Shoshone | 5.7 /100 | #215 | Tragic 6.8% |
| Cherokee | 5.1 /100 | #216 | Tragic 6.8% |
| Aleuts | 4.8 /100 | #217 | Tragic 6.8% |
| Immigrants | Eastern Africa | 4.4 /100 | #218 | Tragic 6.8% |
| Immigrants | Immigrants | 4.3 /100 | #219 | Tragic 6.8% |
| Immigrants | Thailand | 4.0 /100 | #220 | Tragic 6.9% |
| French American Indians | 3.7 /100 | #221 | Tragic 6.9% |
| Immigrants | Bangladesh | 3.7 /100 | #222 | Tragic 6.9% |
| Immigrants | Micronesia | 3.6 /100 | #223 | Tragic 6.9% |
| Immigrants | Sudan | 3.5 /100 | #224 | Tragic 6.9% |
| Sudanese | 3.1 /100 | #225 | Tragic 6.9% |
| Paiute | 2.4 /100 | #226 | Tragic 7.0% |