Immigrants from Moldova vs Canadian Male Poverty
COMPARE
Immigrants from Moldova
Canadian
Male Poverty
Male Poverty Comparison
Immigrants from Moldova
Canadians
9.9%
MALE POVERTY
99.0/ 100
METRIC RATING
43rd/ 347
METRIC RANK
10.5%
MALE POVERTY
91.6/ 100
METRIC RATING
105th/ 347
METRIC RANK
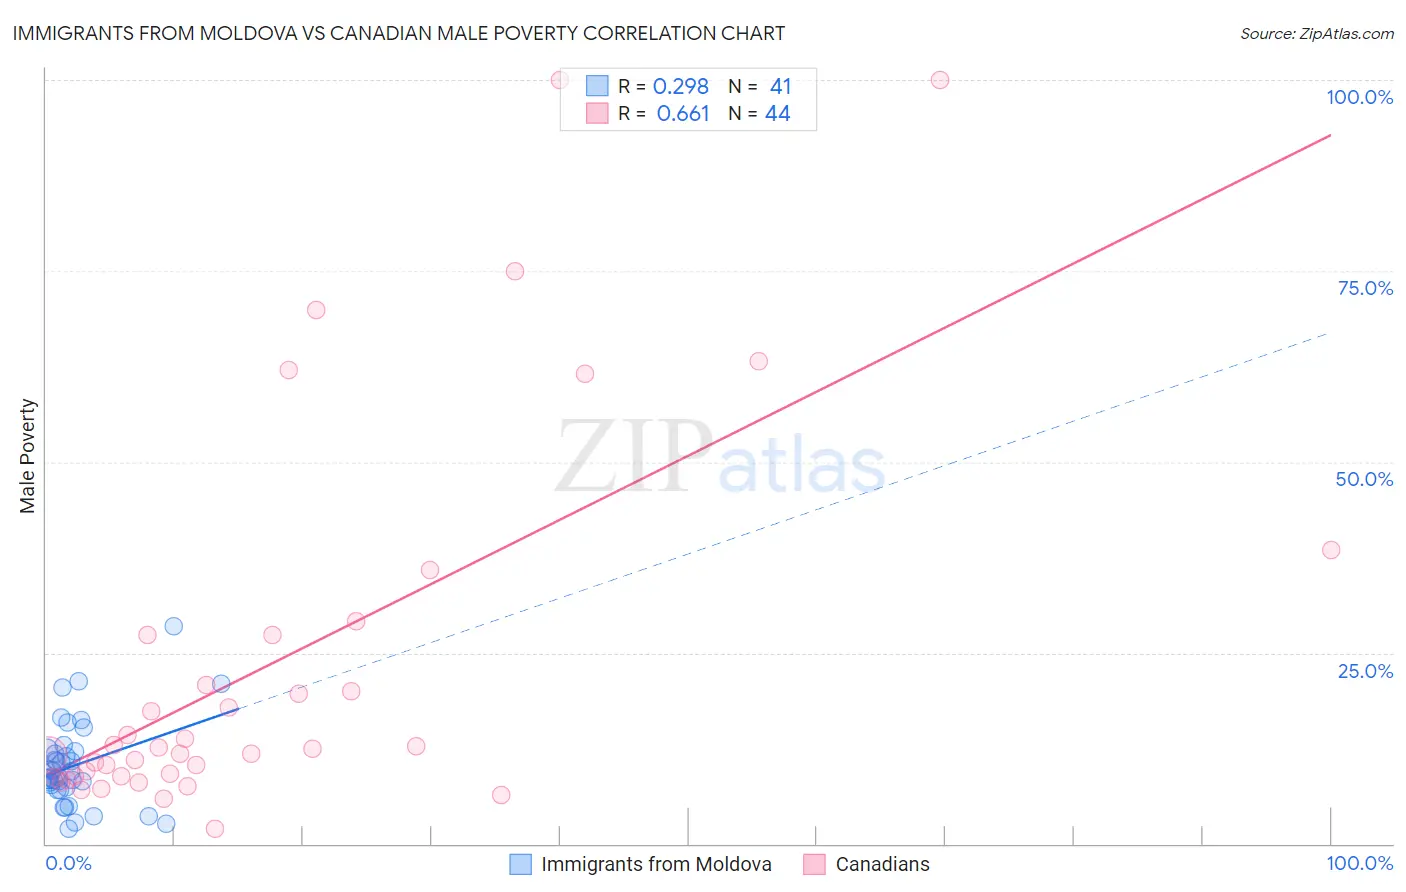
Immigrants from Moldova vs Canadian Male Poverty Correlation Chart
The statistical analysis conducted on geographies consisting of 124,352,223 people shows a weak positive correlation between the proportion of Immigrants from Moldova and poverty level among males in the United States with a correlation coefficient (R) of 0.298 and weighted average of 9.9%. Similarly, the statistical analysis conducted on geographies consisting of 437,032,660 people shows a significant positive correlation between the proportion of Canadians and poverty level among males in the United States with a correlation coefficient (R) of 0.661 and weighted average of 10.5%, a difference of 6.1%.
Male Poverty Correlation Summary
| Measurement | Immigrants from Moldova | Canadian |
| Minimum | 1.9% | 2.0% |
| Maximum | 28.4% | 100.0% |
| Range | 26.5% | 98.0% |
| Mean | 10.3% | 23.8% |
| Median | 8.8% | 12.5% |
| Interquartile 25% (IQ1) | 7.2% | 8.8% |
| Interquartile 75% (IQ3) | 12.2% | 27.3% |
| Interquartile Range (IQR) | 5.0% | 18.5% |
| Standard Deviation (Sample) | 5.6% | 25.0% |
| Standard Deviation (Population) | 5.5% | 24.7% |
Similar Demographics by Male Poverty
Demographics Similar to Immigrants from Moldova by Male Poverty
In terms of male poverty, the demographic groups most similar to Immigrants from Moldova are Immigrants from Romania (9.9%, a difference of 0.22%), Immigrants from Iran (9.9%, a difference of 0.26%), Immigrants from Serbia (10.0%, a difference of 0.40%), Turkish (10.0%, a difference of 0.42%), and Korean (9.9%, a difference of 0.50%).
| Demographics | Rating | Rank | Male Poverty |
| Czechs | 99.4 /100 | #36 | Exceptional 9.8% |
| Immigrants | Greece | 99.3 /100 | #37 | Exceptional 9.8% |
| Immigrants | Pakistan | 99.2 /100 | #38 | Exceptional 9.9% |
| Russians | 99.2 /100 | #39 | Exceptional 9.9% |
| Cypriots | 99.2 /100 | #40 | Exceptional 9.9% |
| Koreans | 99.2 /100 | #41 | Exceptional 9.9% |
| Immigrants | Iran | 99.1 /100 | #42 | Exceptional 9.9% |
| Immigrants | Moldova | 99.0 /100 | #43 | Exceptional 9.9% |
| Immigrants | Romania | 98.9 /100 | #44 | Exceptional 9.9% |
| Immigrants | Serbia | 98.9 /100 | #45 | Exceptional 10.0% |
| Turks | 98.9 /100 | #46 | Exceptional 10.0% |
| Immigrants | Singapore | 98.8 /100 | #47 | Exceptional 10.0% |
| Immigrants | Japan | 98.8 /100 | #48 | Exceptional 10.0% |
| Slovenes | 98.8 /100 | #49 | Exceptional 10.0% |
| Immigrants | Philippines | 98.7 /100 | #50 | Exceptional 10.0% |
Demographics Similar to Canadians by Male Poverty
In terms of male poverty, the demographic groups most similar to Canadians are Welsh (10.5%, a difference of 0.010%), Slavic (10.5%, a difference of 0.020%), Immigrants from Southern Europe (10.5%, a difference of 0.11%), French Canadian (10.5%, a difference of 0.12%), and Laotian (10.5%, a difference of 0.12%).
| Demographics | Rating | Rank | Male Poverty |
| Finns | 93.4 /100 | #98 | Exceptional 10.5% |
| Immigrants | Indonesia | 93.3 /100 | #99 | Exceptional 10.5% |
| Immigrants | Latvia | 92.8 /100 | #100 | Exceptional 10.5% |
| Immigrants | Zimbabwe | 92.0 /100 | #101 | Exceptional 10.5% |
| French Canadians | 91.9 /100 | #102 | Exceptional 10.5% |
| Slavs | 91.7 /100 | #103 | Exceptional 10.5% |
| Welsh | 91.6 /100 | #104 | Exceptional 10.5% |
| Canadians | 91.6 /100 | #105 | Exceptional 10.5% |
| Immigrants | Southern Europe | 91.3 /100 | #106 | Exceptional 10.5% |
| Laotians | 91.2 /100 | #107 | Exceptional 10.5% |
| Portuguese | 91.0 /100 | #108 | Exceptional 10.6% |
| Albanians | 90.6 /100 | #109 | Exceptional 10.6% |
| Argentineans | 90.1 /100 | #110 | Exceptional 10.6% |
| Immigrants | Argentina | 89.8 /100 | #111 | Excellent 10.6% |
| Immigrants | Turkey | 89.5 /100 | #112 | Excellent 10.6% |