Immigrants from Philippines vs Bulgarian Child Poverty Among Girls Under 16
COMPARE
Immigrants from Philippines
Bulgarian
Child Poverty Among Girls Under 16
Child Poverty Among Girls Under 16 Comparison
Immigrants from Philippines
Bulgarians
14.4%
CHILD POVERTY AMONG GIRLS UNDER 16
98.6/ 100
METRIC RATING
64th/ 347
METRIC RANK
13.1%
CHILD POVERTY AMONG GIRLS UNDER 16
99.9/ 100
METRIC RATING
17th/ 347
METRIC RANK
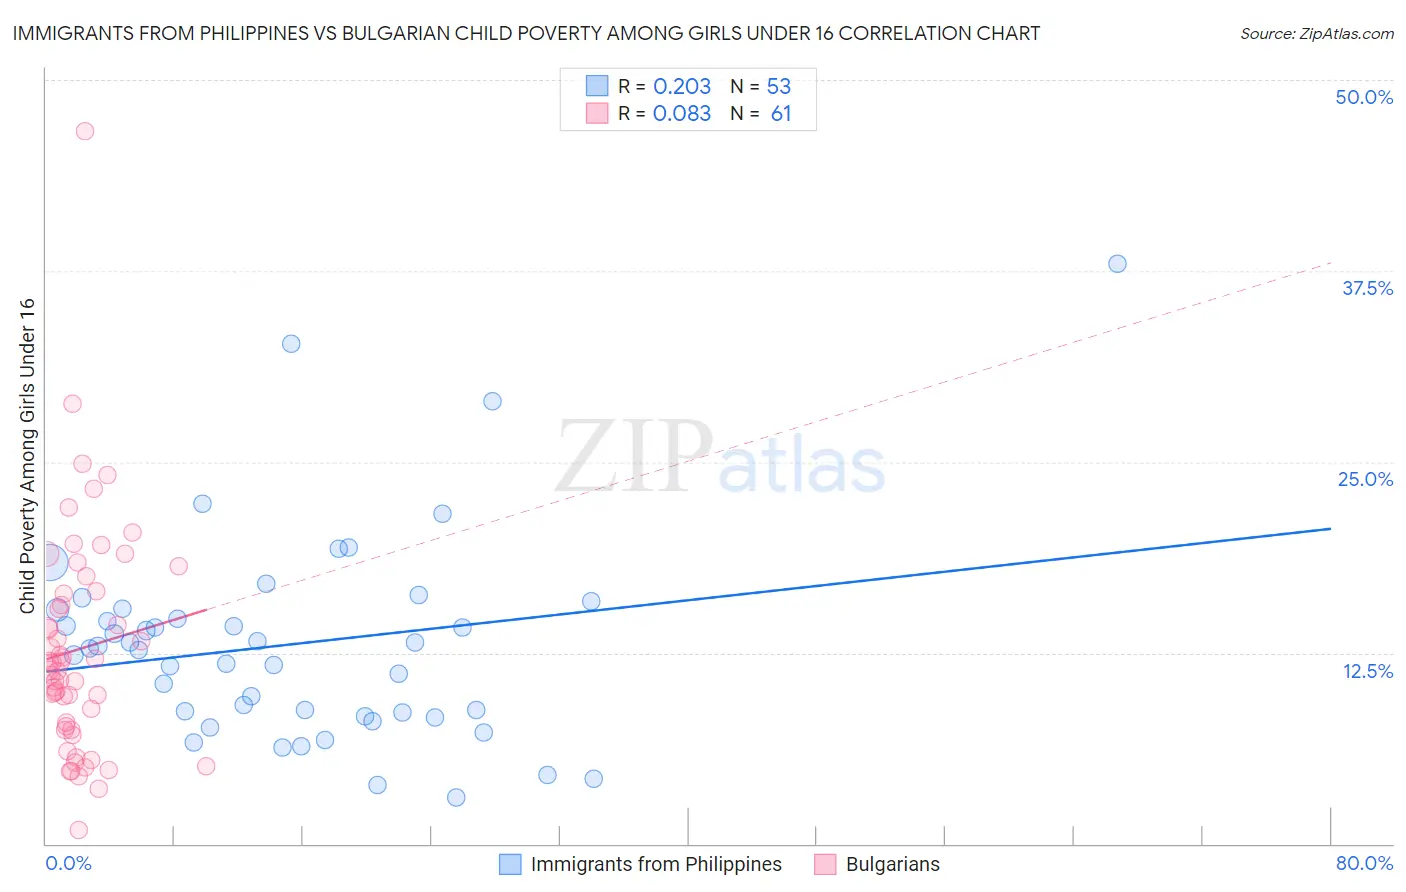
Immigrants from Philippines vs Bulgarian Child Poverty Among Girls Under 16 Correlation Chart
The statistical analysis conducted on geographies consisting of 461,157,064 people shows a weak positive correlation between the proportion of Immigrants from Philippines and poverty level among girls under the age of 16 in the United States with a correlation coefficient (R) of 0.203 and weighted average of 14.4%. Similarly, the statistical analysis conducted on geographies consisting of 202,945,490 people shows a slight positive correlation between the proportion of Bulgarians and poverty level among girls under the age of 16 in the United States with a correlation coefficient (R) of 0.083 and weighted average of 13.1%, a difference of 9.9%.
Child Poverty Among Girls Under 16 Correlation Summary
| Measurement | Immigrants from Philippines | Bulgarian |
| Minimum | 3.0% | 0.87% |
| Maximum | 38.0% | 46.7% |
| Range | 35.0% | 45.8% |
| Mean | 13.1% | 12.7% |
| Median | 12.8% | 11.4% |
| Interquartile 25% (IQ1) | 8.5% | 7.6% |
| Interquartile 75% (IQ3) | 15.3% | 16.4% |
| Interquartile Range (IQR) | 6.9% | 8.9% |
| Standard Deviation (Sample) | 6.7% | 7.4% |
| Standard Deviation (Population) | 6.7% | 7.3% |
Similar Demographics by Child Poverty Among Girls Under 16
Demographics Similar to Immigrants from Philippines by Child Poverty Among Girls Under 16
In terms of child poverty among girls under 16, the demographic groups most similar to Immigrants from Philippines are Immigrants from Sweden (14.5%, a difference of 0.030%), Immigrants from Europe (14.4%, a difference of 0.11%), Scandinavian (14.4%, a difference of 0.16%), Immigrants from Belgium (14.5%, a difference of 0.19%), and Polish (14.4%, a difference of 0.27%).
| Demographics | Rating | Rank | Child Poverty Among Girls Under 16 |
| Immigrants | Serbia | 98.9 /100 | #57 | Exceptional 14.4% |
| Immigrants | Bulgaria | 98.8 /100 | #58 | Exceptional 14.4% |
| Zimbabweans | 98.8 /100 | #59 | Exceptional 14.4% |
| Poles | 98.7 /100 | #60 | Exceptional 14.4% |
| Cambodians | 98.7 /100 | #61 | Exceptional 14.4% |
| Scandinavians | 98.7 /100 | #62 | Exceptional 14.4% |
| Immigrants | Europe | 98.7 /100 | #63 | Exceptional 14.4% |
| Immigrants | Philippines | 98.6 /100 | #64 | Exceptional 14.4% |
| Immigrants | Sweden | 98.6 /100 | #65 | Exceptional 14.5% |
| Immigrants | Belgium | 98.5 /100 | #66 | Exceptional 14.5% |
| Laotians | 98.4 /100 | #67 | Exceptional 14.5% |
| Immigrants | Argentina | 98.3 /100 | #68 | Exceptional 14.6% |
| Immigrants | Poland | 98.2 /100 | #69 | Exceptional 14.6% |
| Europeans | 98.1 /100 | #70 | Exceptional 14.6% |
| Slovenes | 98.1 /100 | #71 | Exceptional 14.6% |
Demographics Similar to Bulgarians by Child Poverty Among Girls Under 16
In terms of child poverty among girls under 16, the demographic groups most similar to Bulgarians are Immigrants from Korea (13.1%, a difference of 0.020%), Immigrants from Lithuania (13.1%, a difference of 0.080%), Cypriot (13.2%, a difference of 0.39%), Okinawan (13.0%, a difference of 1.0%), and Burmese (13.0%, a difference of 1.0%).
| Demographics | Rating | Rank | Child Poverty Among Girls Under 16 |
| Immigrants | Iran | 100.0 /100 | #10 | Exceptional 12.6% |
| Immigrants | South Central Asia | 100.0 /100 | #11 | Exceptional 12.7% |
| Bhutanese | 100.0 /100 | #12 | Exceptional 12.7% |
| Immigrants | Ireland | 99.9 /100 | #13 | Exceptional 12.9% |
| Burmese | 99.9 /100 | #14 | Exceptional 13.0% |
| Okinawans | 99.9 /100 | #15 | Exceptional 13.0% |
| Immigrants | Lithuania | 99.9 /100 | #16 | Exceptional 13.1% |
| Bulgarians | 99.9 /100 | #17 | Exceptional 13.1% |
| Immigrants | Korea | 99.9 /100 | #18 | Exceptional 13.1% |
| Cypriots | 99.9 /100 | #19 | Exceptional 13.2% |
| Immigrants | Japan | 99.9 /100 | #20 | Exceptional 13.3% |
| Assyrians/Chaldeans/Syriacs | 99.9 /100 | #21 | Exceptional 13.3% |
| Indians (Asian) | 99.9 /100 | #22 | Exceptional 13.3% |
| Norwegians | 99.9 /100 | #23 | Exceptional 13.3% |
| Immigrants | Eastern Asia | 99.9 /100 | #24 | Exceptional 13.4% |