Immigrants from Micronesia vs Somali Seniors Poverty Over the Age of 65
COMPARE
Immigrants from Micronesia
Somali
Seniors Poverty Over the Age of 65
Seniors Poverty Over the Age of 65 Comparison
Immigrants from Micronesia
Somalis
10.7%
SENIORS POVERTY OVER THE AGE OF 65
70.8/ 100
METRIC RATING
159th/ 347
METRIC RANK
12.3%
SENIORS POVERTY OVER THE AGE OF 65
0.3/ 100
METRIC RATING
251st/ 347
METRIC RANK
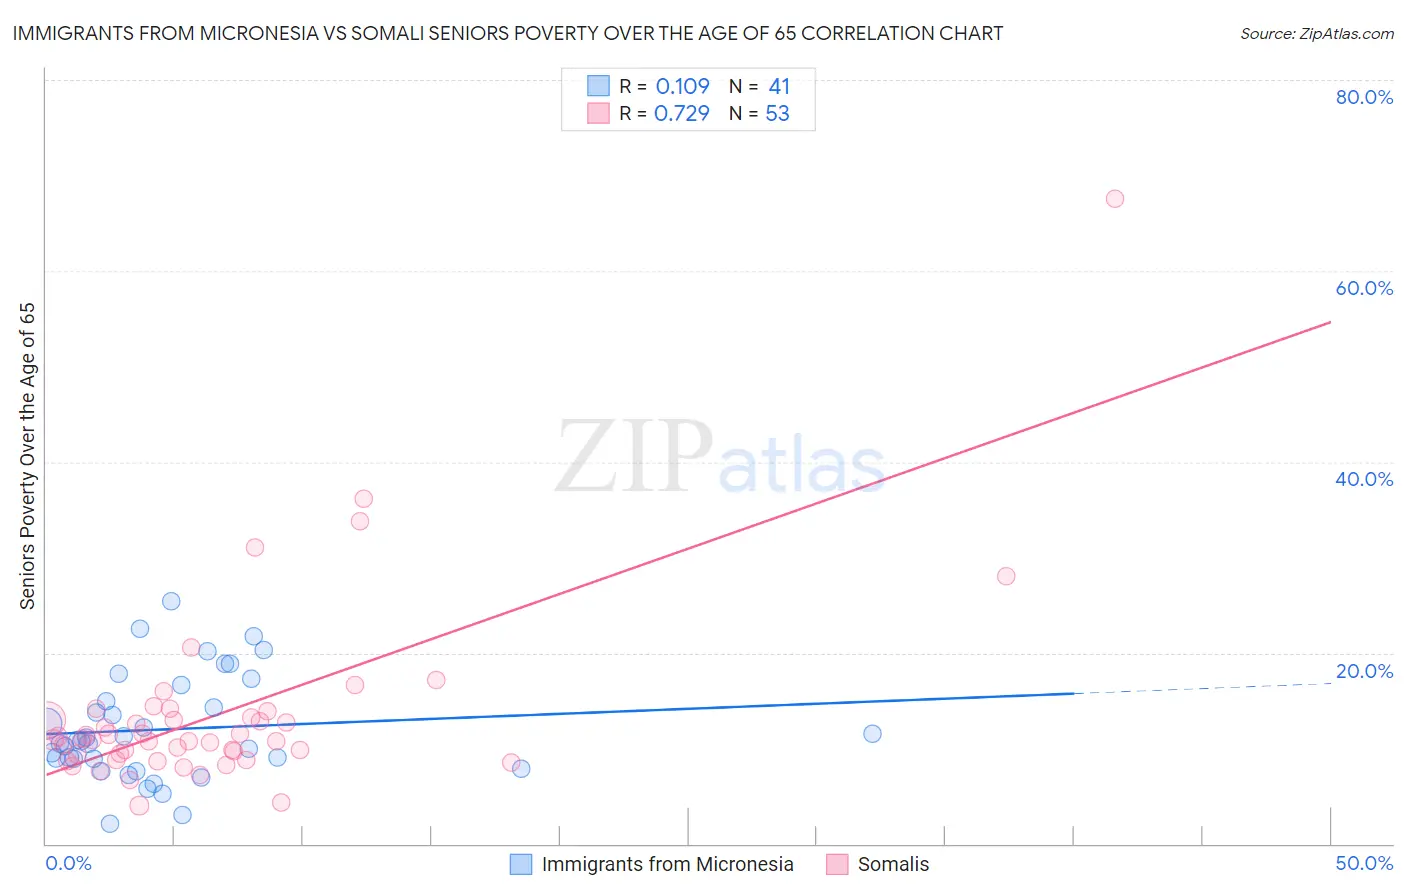
Immigrants from Micronesia vs Somali Seniors Poverty Over the Age of 65 Correlation Chart
The statistical analysis conducted on geographies consisting of 61,393,382 people shows a poor positive correlation between the proportion of Immigrants from Micronesia and poverty level among seniors over the age of 65 in the United States with a correlation coefficient (R) of 0.109 and weighted average of 10.7%. Similarly, the statistical analysis conducted on geographies consisting of 99,180,380 people shows a strong positive correlation between the proportion of Somalis and poverty level among seniors over the age of 65 in the United States with a correlation coefficient (R) of 0.729 and weighted average of 12.3%, a difference of 14.8%.
Seniors Poverty Over the Age of 65 Correlation Summary
| Measurement | Immigrants from Micronesia | Somali |
| Minimum | 2.1% | 4.0% |
| Maximum | 25.4% | 67.5% |
| Range | 23.3% | 63.5% |
| Mean | 12.0% | 13.6% |
| Median | 10.8% | 10.9% |
| Interquartile 25% (IQ1) | 8.4% | 9.1% |
| Interquartile 75% (IQ3) | 15.8% | 13.6% |
| Interquartile Range (IQR) | 7.4% | 4.5% |
| Standard Deviation (Sample) | 5.4% | 9.9% |
| Standard Deviation (Population) | 5.4% | 9.8% |
Similar Demographics by Seniors Poverty Over the Age of 65
Demographics Similar to Immigrants from Micronesia by Seniors Poverty Over the Age of 65
In terms of seniors poverty over the age of 65, the demographic groups most similar to Immigrants from Micronesia are Immigrants from Sierra Leone (10.7%, a difference of 0.10%), Ethiopian (10.7%, a difference of 0.24%), Immigrants from Ethiopia (10.7%, a difference of 0.24%), Sudanese (10.7%, a difference of 0.27%), and Chickasaw (10.7%, a difference of 0.32%).
| Demographics | Rating | Rank | Seniors Poverty Over the Age of 65 |
| Immigrants | Egypt | 76.5 /100 | #152 | Good 10.6% |
| Fijians | 75.6 /100 | #153 | Good 10.7% |
| Immigrants | Saudi Arabia | 74.9 /100 | #154 | Good 10.7% |
| Chickasaw | 73.6 /100 | #155 | Good 10.7% |
| Ethiopians | 72.9 /100 | #156 | Good 10.7% |
| Immigrants | Ethiopia | 72.9 /100 | #157 | Good 10.7% |
| Immigrants | Sierra Leone | 71.7 /100 | #158 | Good 10.7% |
| Immigrants | Micronesia | 70.8 /100 | #159 | Good 10.7% |
| Sudanese | 68.2 /100 | #160 | Good 10.7% |
| Arabs | 65.2 /100 | #161 | Good 10.8% |
| Immigrants | Indonesia | 64.8 /100 | #162 | Good 10.8% |
| Tsimshian | 64.5 /100 | #163 | Good 10.8% |
| Potawatomi | 62.6 /100 | #164 | Good 10.8% |
| Immigrants | South Eastern Asia | 62.1 /100 | #165 | Good 10.8% |
| Malaysians | 62.0 /100 | #166 | Good 10.8% |
Demographics Similar to Somalis by Seniors Poverty Over the Age of 65
In terms of seniors poverty over the age of 65, the demographic groups most similar to Somalis are Armenian (12.3%, a difference of 0.11%), Shoshone (12.3%, a difference of 0.24%), Immigrants from Cambodia (12.4%, a difference of 0.46%), Mexican American Indian (12.4%, a difference of 0.58%), and Immigrants from Liberia (12.2%, a difference of 0.81%).
| Demographics | Rating | Rank | Seniors Poverty Over the Age of 65 |
| Immigrants | Portugal | 0.8 /100 | #244 | Tragic 12.1% |
| Chippewa | 0.7 /100 | #245 | Tragic 12.1% |
| Cree | 0.7 /100 | #246 | Tragic 12.1% |
| Japanese | 0.6 /100 | #247 | Tragic 12.2% |
| Spanish Americans | 0.6 /100 | #248 | Tragic 12.2% |
| Ute | 0.6 /100 | #249 | Tragic 12.2% |
| Immigrants | Liberia | 0.5 /100 | #250 | Tragic 12.2% |
| Somalis | 0.3 /100 | #251 | Tragic 12.3% |
| Armenians | 0.3 /100 | #252 | Tragic 12.3% |
| Shoshone | 0.3 /100 | #253 | Tragic 12.3% |
| Immigrants | Cambodia | 0.3 /100 | #254 | Tragic 12.4% |
| Mexican American Indians | 0.3 /100 | #255 | Tragic 12.4% |
| Immigrants | Panama | 0.2 /100 | #256 | Tragic 12.4% |
| Immigrants | Immigrants | 0.2 /100 | #257 | Tragic 12.4% |
| Dutch West Indians | 0.2 /100 | #258 | Tragic 12.4% |