Immigrants from Micronesia vs Spaniard Seniors Poverty Over the Age of 65
COMPARE
Immigrants from Micronesia
Spaniard
Seniors Poverty Over the Age of 65
Seniors Poverty Over the Age of 65 Comparison
Immigrants from Micronesia
Spaniards
10.7%
SENIORS POVERTY OVER THE AGE OF 65
70.8/ 100
METRIC RATING
159th/ 347
METRIC RANK
10.9%
SENIORS POVERTY OVER THE AGE OF 65
50.7/ 100
METRIC RATING
173rd/ 347
METRIC RANK
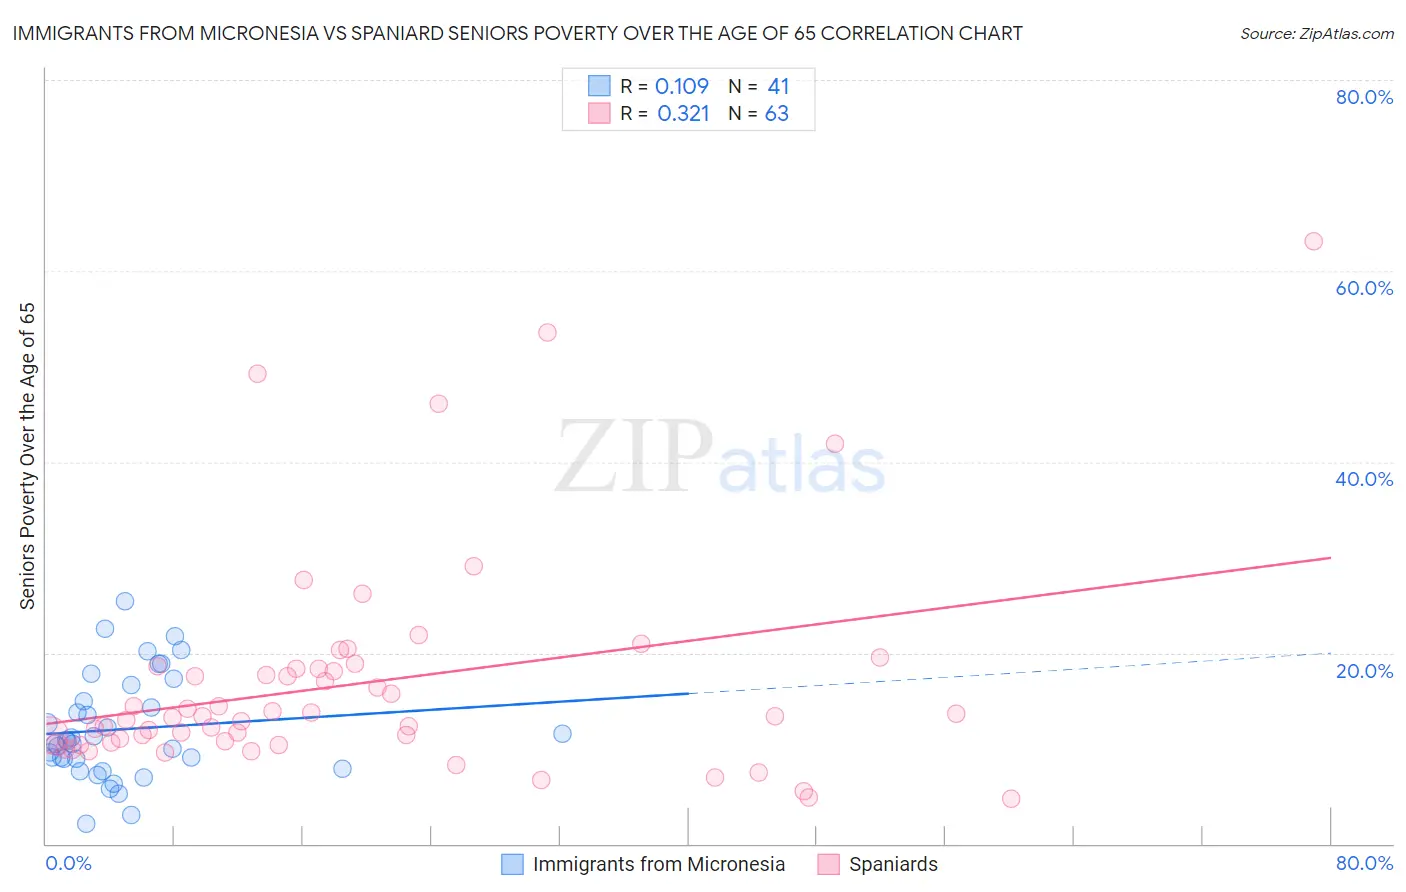
Immigrants from Micronesia vs Spaniard Seniors Poverty Over the Age of 65 Correlation Chart
The statistical analysis conducted on geographies consisting of 61,393,382 people shows a poor positive correlation between the proportion of Immigrants from Micronesia and poverty level among seniors over the age of 65 in the United States with a correlation coefficient (R) of 0.109 and weighted average of 10.7%. Similarly, the statistical analysis conducted on geographies consisting of 441,385,705 people shows a mild positive correlation between the proportion of Spaniards and poverty level among seniors over the age of 65 in the United States with a correlation coefficient (R) of 0.321 and weighted average of 10.9%, a difference of 1.9%.
Seniors Poverty Over the Age of 65 Correlation Summary
| Measurement | Immigrants from Micronesia | Spaniard |
| Minimum | 2.1% | 4.7% |
| Maximum | 25.4% | 63.2% |
| Range | 23.3% | 58.4% |
| Mean | 12.0% | 16.8% |
| Median | 10.8% | 13.4% |
| Interquartile 25% (IQ1) | 8.4% | 10.5% |
| Interquartile 75% (IQ3) | 15.8% | 18.4% |
| Interquartile Range (IQR) | 7.4% | 7.8% |
| Standard Deviation (Sample) | 5.4% | 11.4% |
| Standard Deviation (Population) | 5.4% | 11.4% |
Demographics Similar to Immigrants from Micronesia and Spaniards by Seniors Poverty Over the Age of 65
In terms of seniors poverty over the age of 65, the demographic groups most similar to Immigrants from Micronesia are Immigrants from Sierra Leone (10.7%, a difference of 0.10%), Ethiopian (10.7%, a difference of 0.24%), Immigrants from Ethiopia (10.7%, a difference of 0.24%), Sudanese (10.7%, a difference of 0.27%), and Arab (10.8%, a difference of 0.58%). Similarly, the demographic groups most similar to Spaniards are Immigrants from Sudan (10.9%, a difference of 0.070%), Creek (10.9%, a difference of 0.10%), Immigrants from Malaysia (11.0%, a difference of 0.25%), Immigrants from Syria (10.9%, a difference of 0.35%), and Nonimmigrants (10.9%, a difference of 0.39%).
| Demographics | Rating | Rank | Seniors Poverty Over the Age of 65 |
| Ethiopians | 72.9 /100 | #156 | Good 10.7% |
| Immigrants | Ethiopia | 72.9 /100 | #157 | Good 10.7% |
| Immigrants | Sierra Leone | 71.7 /100 | #158 | Good 10.7% |
| Immigrants | Micronesia | 70.8 /100 | #159 | Good 10.7% |
| Sudanese | 68.2 /100 | #160 | Good 10.7% |
| Arabs | 65.2 /100 | #161 | Good 10.8% |
| Immigrants | Indonesia | 64.8 /100 | #162 | Good 10.8% |
| Tsimshian | 64.5 /100 | #163 | Good 10.8% |
| Potawatomi | 62.6 /100 | #164 | Good 10.8% |
| Immigrants | South Eastern Asia | 62.1 /100 | #165 | Good 10.8% |
| Malaysians | 62.0 /100 | #166 | Good 10.8% |
| Alaska Natives | 60.3 /100 | #167 | Good 10.8% |
| Mongolians | 58.0 /100 | #168 | Average 10.9% |
| Sri Lankans | 56.8 /100 | #169 | Average 10.9% |
| Immigrants | Eastern Europe | 55.8 /100 | #170 | Average 10.9% |
| Immigrants | Nonimmigrants | 55.1 /100 | #171 | Average 10.9% |
| Immigrants | Syria | 54.7 /100 | #172 | Average 10.9% |
| Spaniards | 50.7 /100 | #173 | Average 10.9% |
| Immigrants | Sudan | 50.0 /100 | #174 | Average 10.9% |
| Creek | 49.6 /100 | #175 | Average 10.9% |
| Immigrants | Malaysia | 47.9 /100 | #176 | Average 11.0% |