Nicaraguan vs Somali Seniors Poverty Over the Age of 65
COMPARE
Nicaraguan
Somali
Seniors Poverty Over the Age of 65
Seniors Poverty Over the Age of 65 Comparison
Nicaraguans
Somalis
15.0%
SENIORS POVERTY OVER THE AGE OF 65
0.0/ 100
METRIC RATING
324th/ 347
METRIC RANK
12.3%
SENIORS POVERTY OVER THE AGE OF 65
0.3/ 100
METRIC RATING
251st/ 347
METRIC RANK
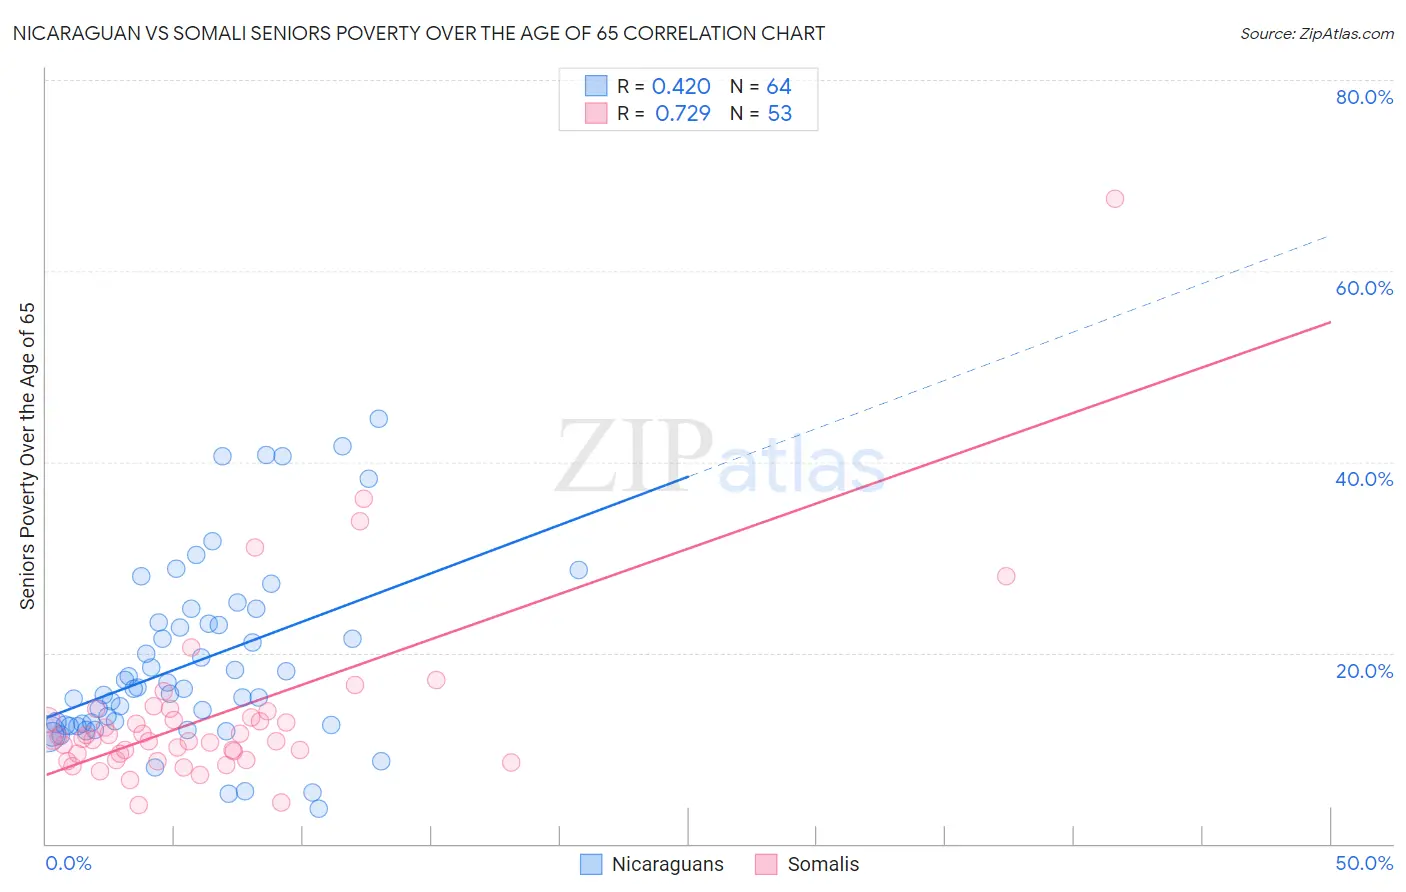
Nicaraguan vs Somali Seniors Poverty Over the Age of 65 Correlation Chart
The statistical analysis conducted on geographies consisting of 285,162,834 people shows a moderate positive correlation between the proportion of Nicaraguans and poverty level among seniors over the age of 65 in the United States with a correlation coefficient (R) of 0.420 and weighted average of 15.0%. Similarly, the statistical analysis conducted on geographies consisting of 99,180,380 people shows a strong positive correlation between the proportion of Somalis and poverty level among seniors over the age of 65 in the United States with a correlation coefficient (R) of 0.729 and weighted average of 12.3%, a difference of 21.9%.
Seniors Poverty Over the Age of 65 Correlation Summary
| Measurement | Nicaraguan | Somali |
| Minimum | 3.7% | 4.0% |
| Maximum | 44.5% | 67.5% |
| Range | 40.8% | 63.5% |
| Mean | 18.9% | 13.6% |
| Median | 16.2% | 10.9% |
| Interquartile 25% (IQ1) | 12.5% | 9.1% |
| Interquartile 75% (IQ3) | 23.1% | 13.6% |
| Interquartile Range (IQR) | 10.7% | 4.5% |
| Standard Deviation (Sample) | 9.5% | 9.9% |
| Standard Deviation (Population) | 9.4% | 9.8% |
Similar Demographics by Seniors Poverty Over the Age of 65
Demographics Similar to Nicaraguans by Seniors Poverty Over the Age of 65
In terms of seniors poverty over the age of 65, the demographic groups most similar to Nicaraguans are Central American Indian (15.1%, a difference of 0.59%), Immigrants from Armenia (15.2%, a difference of 1.2%), Yakama (14.8%, a difference of 1.4%), Crow (15.2%, a difference of 1.5%), and Immigrants from Barbados (14.8%, a difference of 1.5%).
| Demographics | Rating | Rank | Seniors Poverty Over the Age of 65 |
| Haitians | 0.0 /100 | #317 | Tragic 14.5% |
| Immigrants | Honduras | 0.0 /100 | #318 | Tragic 14.5% |
| Cape Verdeans | 0.0 /100 | #319 | Tragic 14.7% |
| Immigrants | Haiti | 0.0 /100 | #320 | Tragic 14.7% |
| Houma | 0.0 /100 | #321 | Tragic 14.7% |
| Immigrants | Barbados | 0.0 /100 | #322 | Tragic 14.8% |
| Yakama | 0.0 /100 | #323 | Tragic 14.8% |
| Nicaraguans | 0.0 /100 | #324 | Tragic 15.0% |
| Central American Indians | 0.0 /100 | #325 | Tragic 15.1% |
| Immigrants | Armenia | 0.0 /100 | #326 | Tragic 15.2% |
| Crow | 0.0 /100 | #327 | Tragic 15.2% |
| Sioux | 0.0 /100 | #328 | Tragic 15.3% |
| Immigrants | Dominica | 0.0 /100 | #329 | Tragic 15.5% |
| Immigrants | St. Vincent and the Grenadines | 0.0 /100 | #330 | Tragic 15.5% |
| British West Indians | 0.0 /100 | #331 | Tragic 15.6% |
Demographics Similar to Somalis by Seniors Poverty Over the Age of 65
In terms of seniors poverty over the age of 65, the demographic groups most similar to Somalis are Armenian (12.3%, a difference of 0.11%), Shoshone (12.3%, a difference of 0.24%), Immigrants from Cambodia (12.4%, a difference of 0.46%), Mexican American Indian (12.4%, a difference of 0.58%), and Immigrants from Liberia (12.2%, a difference of 0.81%).
| Demographics | Rating | Rank | Seniors Poverty Over the Age of 65 |
| Immigrants | Portugal | 0.8 /100 | #244 | Tragic 12.1% |
| Chippewa | 0.7 /100 | #245 | Tragic 12.1% |
| Cree | 0.7 /100 | #246 | Tragic 12.1% |
| Japanese | 0.6 /100 | #247 | Tragic 12.2% |
| Spanish Americans | 0.6 /100 | #248 | Tragic 12.2% |
| Ute | 0.6 /100 | #249 | Tragic 12.2% |
| Immigrants | Liberia | 0.5 /100 | #250 | Tragic 12.2% |
| Somalis | 0.3 /100 | #251 | Tragic 12.3% |
| Armenians | 0.3 /100 | #252 | Tragic 12.3% |
| Shoshone | 0.3 /100 | #253 | Tragic 12.3% |
| Immigrants | Cambodia | 0.3 /100 | #254 | Tragic 12.4% |
| Mexican American Indians | 0.3 /100 | #255 | Tragic 12.4% |
| Immigrants | Panama | 0.2 /100 | #256 | Tragic 12.4% |
| Immigrants | Immigrants | 0.2 /100 | #257 | Tragic 12.4% |
| Dutch West Indians | 0.2 /100 | #258 | Tragic 12.4% |