Immigrants from Micronesia vs Somali 8th Grade
COMPARE
Immigrants from Micronesia
Somali
8th Grade
8th Grade Comparison
Immigrants from Micronesia
Somalis
95.6%
8TH GRADE
31.6/ 100
METRIC RATING
189th/ 347
METRIC RANK
95.1%
8TH GRADE
1.4/ 100
METRIC RATING
246th/ 347
METRIC RANK
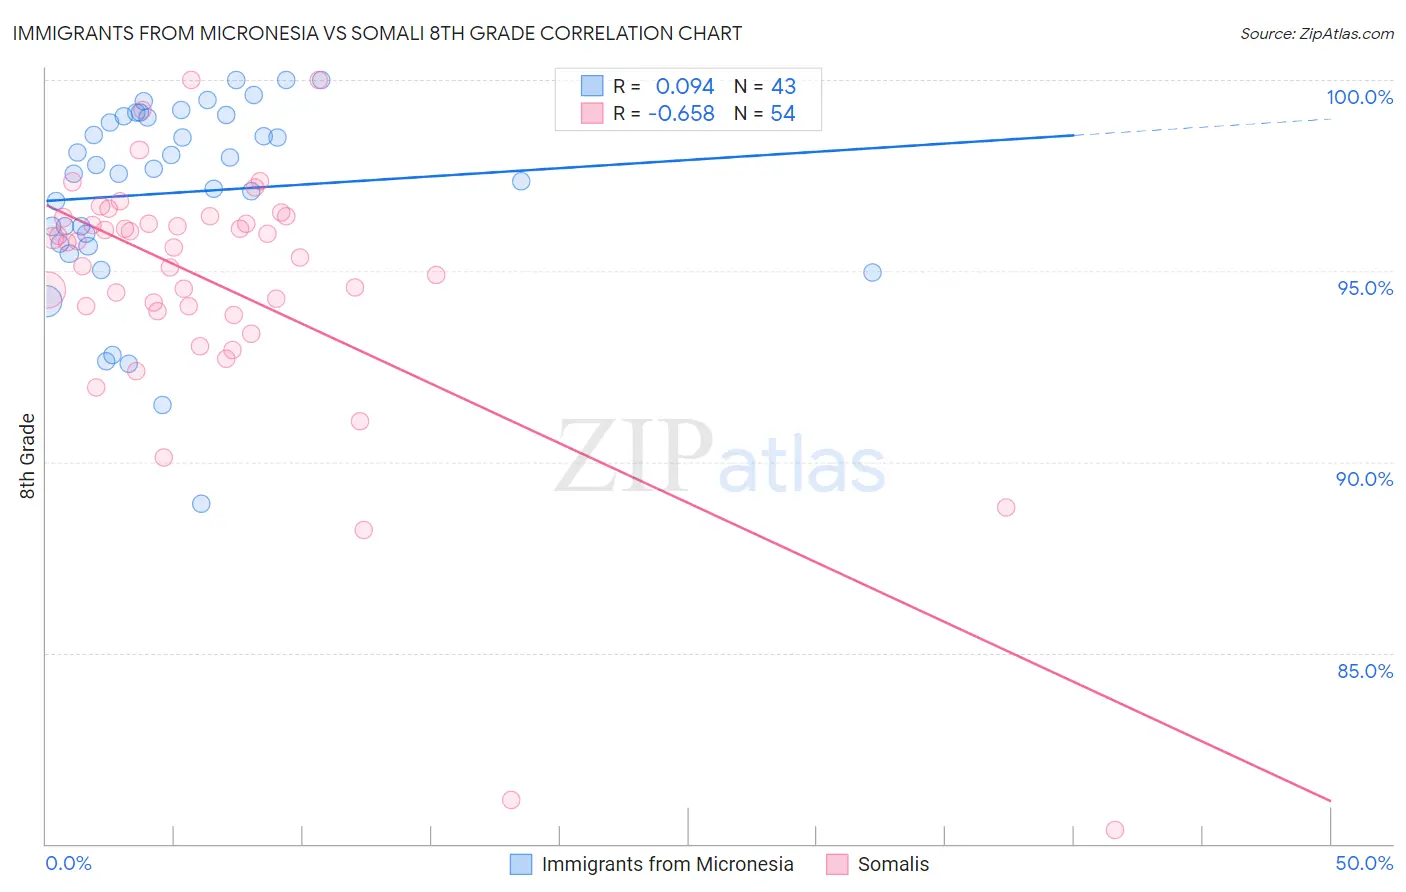
Immigrants from Micronesia vs Somali 8th Grade Correlation Chart
The statistical analysis conducted on geographies consisting of 61,604,657 people shows a slight positive correlation between the proportion of Immigrants from Micronesia and percentage of population with at least 8th grade education in the United States with a correlation coefficient (R) of 0.094 and weighted average of 95.6%. Similarly, the statistical analysis conducted on geographies consisting of 99,332,457 people shows a significant negative correlation between the proportion of Somalis and percentage of population with at least 8th grade education in the United States with a correlation coefficient (R) of -0.658 and weighted average of 95.1%, a difference of 0.57%.
8th Grade Correlation Summary
| Measurement | Immigrants from Micronesia | Somali |
| Minimum | 88.9% | 80.4% |
| Maximum | 100.0% | 100.0% |
| Range | 11.1% | 19.6% |
| Mean | 97.0% | 94.6% |
| Median | 97.7% | 95.7% |
| Interquartile 25% (IQ1) | 95.7% | 94.0% |
| Interquartile 75% (IQ3) | 99.1% | 96.4% |
| Interquartile Range (IQR) | 3.4% | 2.4% |
| Standard Deviation (Sample) | 2.5% | 3.6% |
| Standard Deviation (Population) | 2.5% | 3.6% |
Similar Demographics by 8th Grade
Demographics Similar to Immigrants from Micronesia by 8th Grade
In terms of 8th grade, the demographic groups most similar to Immigrants from Micronesia are Sudanese (95.6%, a difference of 0.010%), Liberian (95.6%, a difference of 0.010%), Immigrants from Venezuela (95.6%, a difference of 0.010%), Immigrants from Nepal (95.6%, a difference of 0.010%), and Black/African American (95.6%, a difference of 0.020%).
| Demographics | Rating | Rank | 8th Grade |
| Immigrants | Egypt | 37.9 /100 | #182 | Fair 95.7% |
| Immigrants | Iraq | 36.2 /100 | #183 | Fair 95.6% |
| Immigrants | Uganda | 36.0 /100 | #184 | Fair 95.6% |
| Blacks/African Americans | 34.8 /100 | #185 | Fair 95.6% |
| Brazilians | 34.8 /100 | #186 | Fair 95.6% |
| Sudanese | 33.0 /100 | #187 | Fair 95.6% |
| Liberians | 32.4 /100 | #188 | Fair 95.6% |
| Immigrants | Micronesia | 31.6 /100 | #189 | Fair 95.6% |
| Immigrants | Venezuela | 30.8 /100 | #190 | Fair 95.6% |
| Immigrants | Nepal | 30.2 /100 | #191 | Fair 95.6% |
| Pima | 28.6 /100 | #192 | Fair 95.6% |
| Panamanians | 28.4 /100 | #193 | Fair 95.6% |
| Guamanians/Chamorros | 26.6 /100 | #194 | Fair 95.6% |
| Immigrants | Zaire | 25.2 /100 | #195 | Fair 95.6% |
| Assyrians/Chaldeans/Syriacs | 24.5 /100 | #196 | Fair 95.6% |
Demographics Similar to Somalis by 8th Grade
In terms of 8th grade, the demographic groups most similar to Somalis are Immigrants from Senegal (95.1%, a difference of 0.0%), Jamaican (95.1%, a difference of 0.010%), Uruguayan (95.1%, a difference of 0.020%), Tongan (95.1%, a difference of 0.040%), and Paiute (95.1%, a difference of 0.040%).
| Demographics | Rating | Rank | 8th Grade |
| Immigrants | Sierra Leone | 2.1 /100 | #239 | Tragic 95.1% |
| Ethiopians | 2.0 /100 | #240 | Tragic 95.1% |
| South American Indians | 1.9 /100 | #241 | Tragic 95.1% |
| Tongans | 1.7 /100 | #242 | Tragic 95.1% |
| Paiute | 1.7 /100 | #243 | Tragic 95.1% |
| Immigrants | Middle Africa | 1.7 /100 | #244 | Tragic 95.1% |
| Jamaicans | 1.4 /100 | #245 | Tragic 95.1% |
| Somalis | 1.4 /100 | #246 | Tragic 95.1% |
| Immigrants | Senegal | 1.4 /100 | #247 | Tragic 95.1% |
| Uruguayans | 1.2 /100 | #248 | Tragic 95.1% |
| Immigrants | China | 1.1 /100 | #249 | Tragic 95.0% |
| Koreans | 1.1 /100 | #250 | Tragic 95.0% |
| Bolivians | 1.0 /100 | #251 | Tragic 95.0% |
| Immigrants | Ethiopia | 1.0 /100 | #252 | Tragic 95.0% |
| U.S. Virgin Islanders | 0.9 /100 | #253 | Tragic 95.0% |