Immigrants from Mexico vs U.S. Virgin Islander Single Mother Households
COMPARE
Immigrants from Mexico
U.S. Virgin Islander
Single Mother Households
Single Mother Households Comparison
Immigrants from Mexico
U.S. Virgin Islanders
8.2%
SINGLE MOTHER HOUSEHOLDS
0.0/ 100
METRIC RATING
314th/ 347
METRIC RANK
8.6%
SINGLE MOTHER HOUSEHOLDS
0.0/ 100
METRIC RATING
332nd/ 347
METRIC RANK
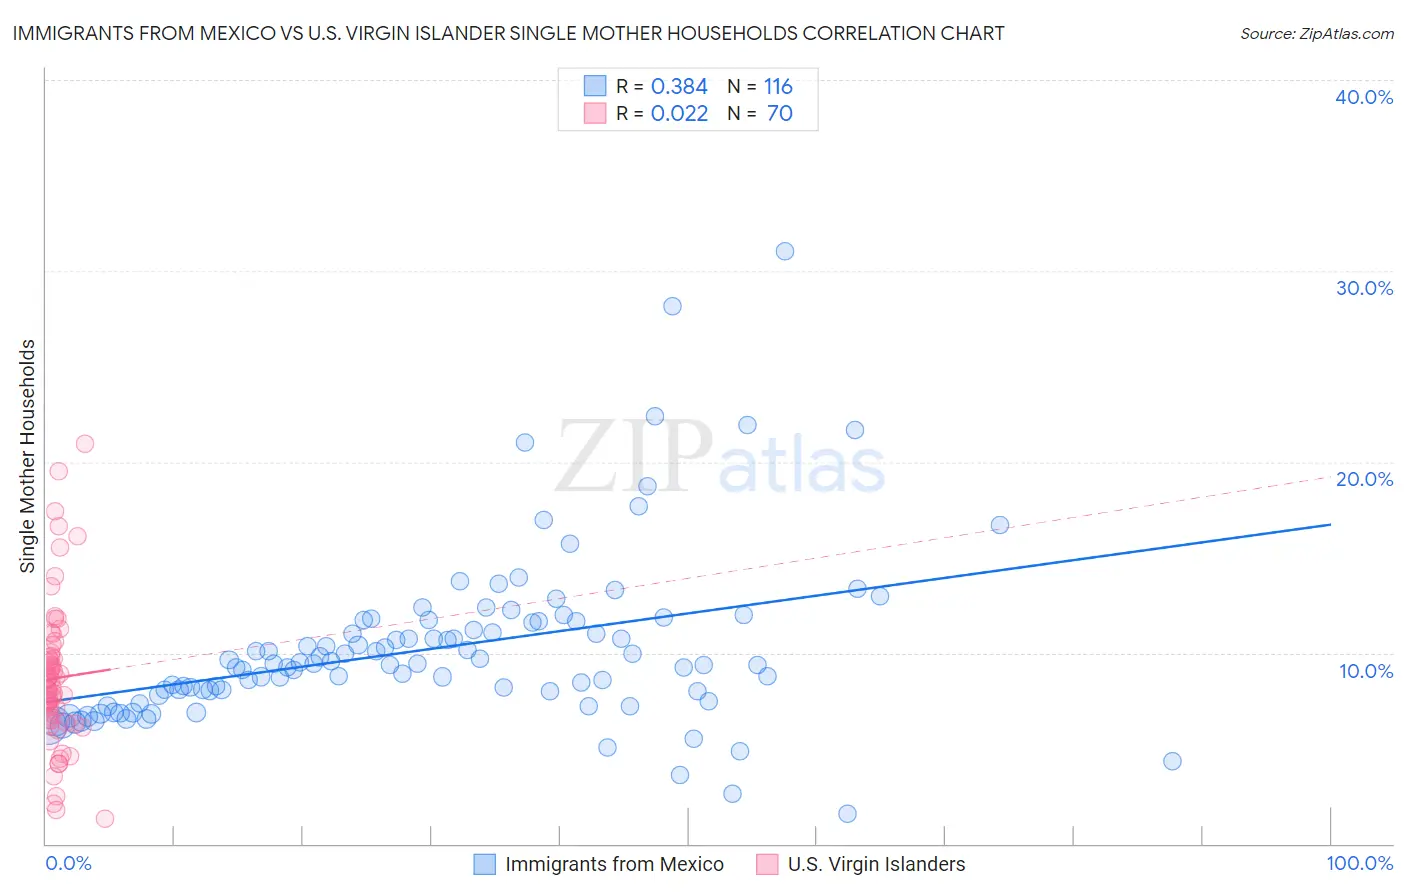
Immigrants from Mexico vs U.S. Virgin Islander Single Mother Households Correlation Chart
The statistical analysis conducted on geographies consisting of 511,292,924 people shows a mild positive correlation between the proportion of Immigrants from Mexico and percentage of single mother households in the United States with a correlation coefficient (R) of 0.384 and weighted average of 8.2%. Similarly, the statistical analysis conducted on geographies consisting of 87,484,063 people shows no correlation between the proportion of U.S. Virgin Islanders and percentage of single mother households in the United States with a correlation coefficient (R) of 0.022 and weighted average of 8.6%, a difference of 5.5%.
Single Mother Households Correlation Summary
| Measurement | Immigrants from Mexico | U.S. Virgin Islander |
| Minimum | 1.6% | 1.3% |
| Maximum | 31.0% | 21.0% |
| Range | 29.5% | 19.7% |
| Mean | 10.2% | 8.7% |
| Median | 9.4% | 8.1% |
| Interquartile 25% (IQ1) | 7.9% | 6.5% |
| Interquartile 75% (IQ3) | 11.6% | 9.8% |
| Interquartile Range (IQR) | 3.7% | 3.3% |
| Standard Deviation (Sample) | 4.5% | 3.8% |
| Standard Deviation (Population) | 4.4% | 3.8% |
Demographics Similar to Immigrants from Mexico and U.S. Virgin Islanders by Single Mother Households
In terms of single mother households, the demographic groups most similar to Immigrants from Mexico are Immigrants from Western Africa (8.2%, a difference of 0.030%), Immigrants from Grenada (8.2%, a difference of 0.12%), African (8.2%, a difference of 0.17%), Immigrants from Honduras (8.2%, a difference of 0.31%), and Senegalese (8.2%, a difference of 0.88%). Similarly, the demographic groups most similar to U.S. Virgin Islanders are Liberian (8.6%, a difference of 0.33%), Inupiat (8.5%, a difference of 1.5%), Sioux (8.5%, a difference of 1.5%), Hopi (8.5%, a difference of 1.6%), and Yakama (8.4%, a difference of 2.4%).
| Demographics | Rating | Rank | Single Mother Households |
| Immigrants | Grenada | 0.0 /100 | #313 | Tragic 8.2% |
| Immigrants | Mexico | 0.0 /100 | #314 | Tragic 8.2% |
| Immigrants | Western Africa | 0.0 /100 | #315 | Tragic 8.2% |
| Africans | 0.0 /100 | #316 | Tragic 8.2% |
| Immigrants | Honduras | 0.0 /100 | #317 | Tragic 8.2% |
| Senegalese | 0.0 /100 | #318 | Tragic 8.2% |
| Jamaicans | 0.0 /100 | #319 | Tragic 8.2% |
| Bahamians | 0.0 /100 | #320 | Tragic 8.3% |
| Immigrants | Senegal | 0.0 /100 | #321 | Tragic 8.3% |
| Pima | 0.0 /100 | #322 | Tragic 8.3% |
| Haitians | 0.0 /100 | #323 | Tragic 8.3% |
| Immigrants | Jamaica | 0.0 /100 | #324 | Tragic 8.4% |
| Immigrants | Caribbean | 0.0 /100 | #325 | Tragic 8.4% |
| British West Indians | 0.0 /100 | #326 | Tragic 8.4% |
| Immigrants | Haiti | 0.0 /100 | #327 | Tragic 8.4% |
| Yakama | 0.0 /100 | #328 | Tragic 8.4% |
| Hopi | 0.0 /100 | #329 | Tragic 8.5% |
| Inupiat | 0.0 /100 | #330 | Tragic 8.5% |
| Sioux | 0.0 /100 | #331 | Tragic 8.5% |
| U.S. Virgin Islanders | 0.0 /100 | #332 | Tragic 8.6% |
| Liberians | 0.0 /100 | #333 | Tragic 8.6% |