Immigrants from Mexico vs Marshallese Male Poverty
COMPARE
Immigrants from Mexico
Marshallese
Male Poverty
Male Poverty Comparison
Immigrants from Mexico
Marshallese
14.0%
MALE POVERTY
0.0/ 100
METRIC RATING
300th/ 347
METRIC RANK
12.5%
MALE POVERTY
0.8/ 100
METRIC RATING
230th/ 347
METRIC RANK
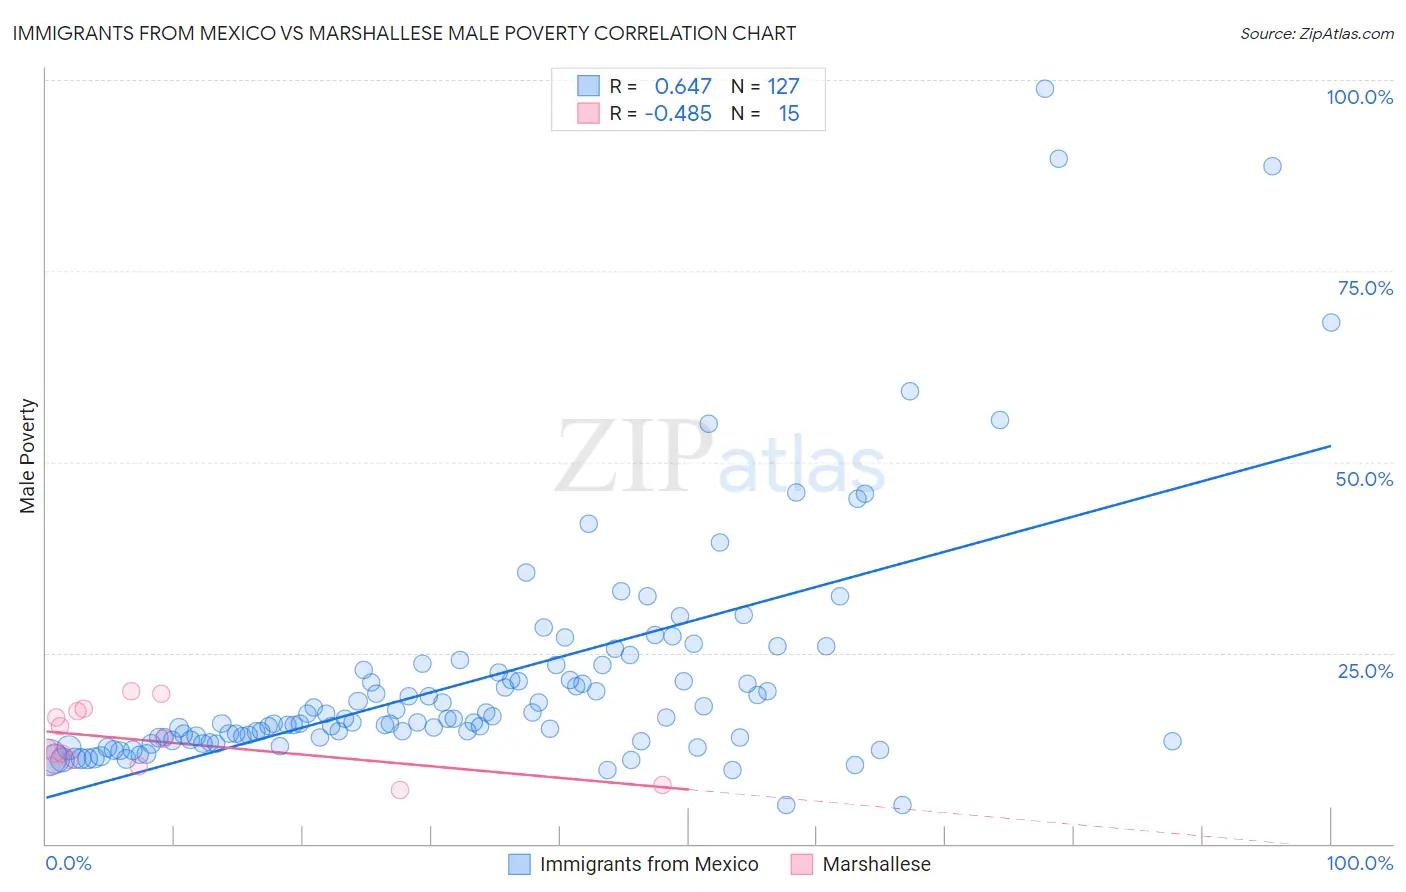
Immigrants from Mexico vs Marshallese Male Poverty Correlation Chart
The statistical analysis conducted on geographies consisting of 513,064,381 people shows a significant positive correlation between the proportion of Immigrants from Mexico and poverty level among males in the United States with a correlation coefficient (R) of 0.647 and weighted average of 14.0%. Similarly, the statistical analysis conducted on geographies consisting of 14,760,991 people shows a moderate negative correlation between the proportion of Marshallese and poverty level among males in the United States with a correlation coefficient (R) of -0.485 and weighted average of 12.5%, a difference of 12.3%.
Male Poverty Correlation Summary
| Measurement | Immigrants from Mexico | Marshallese |
| Minimum | 5.0% | 7.0% |
| Maximum | 98.8% | 20.0% |
| Range | 93.8% | 13.0% |
| Mean | 21.4% | 13.5% |
| Median | 15.9% | 12.5% |
| Interquartile 25% (IQ1) | 13.5% | 10.2% |
| Interquartile 75% (IQ3) | 22.7% | 17.3% |
| Interquartile Range (IQR) | 9.2% | 7.2% |
| Standard Deviation (Sample) | 15.3% | 4.1% |
| Standard Deviation (Population) | 15.2% | 4.0% |
Similar Demographics by Male Poverty
Demographics Similar to Immigrants from Mexico by Male Poverty
In terms of male poverty, the demographic groups most similar to Immigrants from Mexico are Immigrants from Senegal (14.0%, a difference of 0.070%), Immigrants from Guatemala (14.0%, a difference of 0.12%), Immigrants from Caribbean (14.0%, a difference of 0.13%), Bahamian (14.1%, a difference of 0.17%), and Blackfeet (14.0%, a difference of 0.22%).
| Demographics | Rating | Rank | Male Poverty |
| Immigrants | Belize | 0.0 /100 | #293 | Tragic 13.8% |
| Hispanics or Latinos | 0.0 /100 | #294 | Tragic 13.9% |
| Immigrants | Central America | 0.0 /100 | #295 | Tragic 13.9% |
| Cajuns | 0.0 /100 | #296 | Tragic 13.9% |
| Inupiat | 0.0 /100 | #297 | Tragic 14.0% |
| Blackfeet | 0.0 /100 | #298 | Tragic 14.0% |
| Immigrants | Guatemala | 0.0 /100 | #299 | Tragic 14.0% |
| Immigrants | Mexico | 0.0 /100 | #300 | Tragic 14.0% |
| Immigrants | Senegal | 0.0 /100 | #301 | Tragic 14.0% |
| Immigrants | Caribbean | 0.0 /100 | #302 | Tragic 14.0% |
| Bahamians | 0.0 /100 | #303 | Tragic 14.1% |
| Senegalese | 0.0 /100 | #304 | Tragic 14.1% |
| Immigrants | Bangladesh | 0.0 /100 | #305 | Tragic 14.1% |
| Creek | 0.0 /100 | #306 | Tragic 14.1% |
| Dutch West Indians | 0.0 /100 | #307 | Tragic 14.2% |
Demographics Similar to Marshallese by Male Poverty
In terms of male poverty, the demographic groups most similar to Marshallese are Salvadoran (12.6%, a difference of 0.56%), Nicaraguan (12.6%, a difference of 0.68%), Fijian (12.6%, a difference of 0.72%), Immigrants from Armenia (12.6%, a difference of 0.79%), and Cuban (12.4%, a difference of 0.98%).
| Demographics | Rating | Rank | Male Poverty |
| Immigrants | Micronesia | 2.1 /100 | #223 | Tragic 12.2% |
| Immigrants | Nigeria | 1.6 /100 | #224 | Tragic 12.3% |
| Osage | 1.5 /100 | #225 | Tragic 12.3% |
| Nigerians | 1.4 /100 | #226 | Tragic 12.3% |
| Alaska Natives | 1.4 /100 | #227 | Tragic 12.4% |
| Alsatians | 1.3 /100 | #228 | Tragic 12.4% |
| Cubans | 1.3 /100 | #229 | Tragic 12.4% |
| Marshallese | 0.8 /100 | #230 | Tragic 12.5% |
| Salvadorans | 0.6 /100 | #231 | Tragic 12.6% |
| Nicaraguans | 0.6 /100 | #232 | Tragic 12.6% |
| Fijians | 0.6 /100 | #233 | Tragic 12.6% |
| Immigrants | Armenia | 0.6 /100 | #234 | Tragic 12.6% |
| Immigrants | Laos | 0.5 /100 | #235 | Tragic 12.6% |
| Immigrants | Saudi Arabia | 0.4 /100 | #236 | Tragic 12.7% |
| French American Indians | 0.4 /100 | #237 | Tragic 12.7% |