Immigrants from Lithuania vs Soviet Union Child Poverty Under the Age of 5
COMPARE
Immigrants from Lithuania
Soviet Union
Child Poverty Under the Age of 5
Child Poverty Under the Age of 5 Comparison
Immigrants from Lithuania
Soviet Union
14.1%
CHILD POVERTY UNDER THE AGE OF 5
99.9/ 100
METRIC RATING
26th/ 347
METRIC RANK
14.7%
CHILD POVERTY UNDER THE AGE OF 5
99.7/ 100
METRIC RATING
42nd/ 347
METRIC RANK
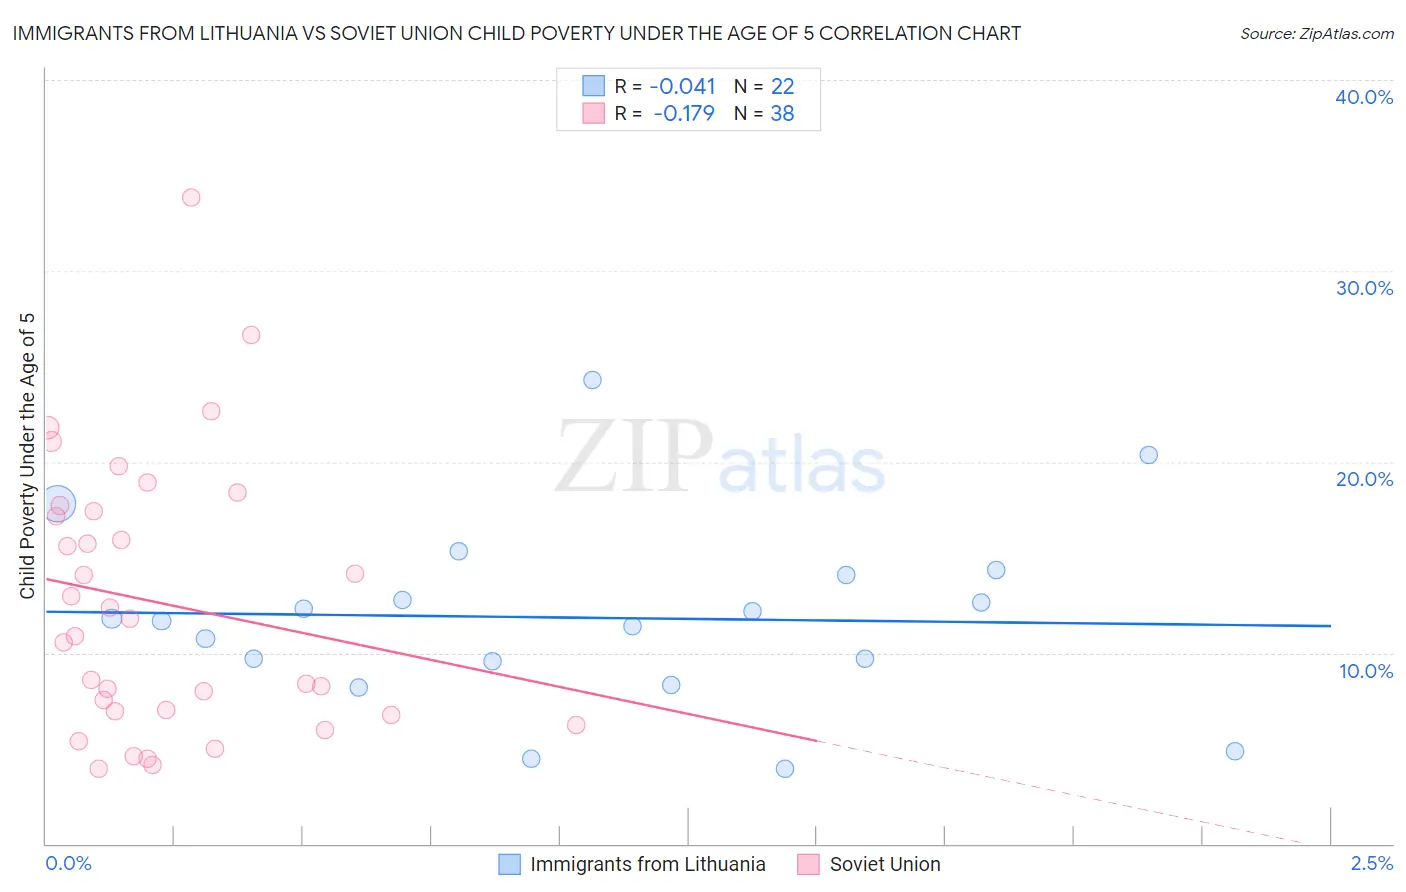
Immigrants from Lithuania vs Soviet Union Child Poverty Under the Age of 5 Correlation Chart
The statistical analysis conducted on geographies consisting of 114,250,981 people shows no correlation between the proportion of Immigrants from Lithuania and poverty level among children under the age of 5 in the United States with a correlation coefficient (R) of -0.041 and weighted average of 14.1%. Similarly, the statistical analysis conducted on geographies consisting of 43,034,712 people shows a poor negative correlation between the proportion of Soviet Union and poverty level among children under the age of 5 in the United States with a correlation coefficient (R) of -0.179 and weighted average of 14.7%, a difference of 4.2%.
Child Poverty Under the Age of 5 Correlation Summary
| Measurement | Immigrants from Lithuania | Soviet Union |
| Minimum | 3.9% | 3.9% |
| Maximum | 24.3% | 33.8% |
| Range | 20.4% | 29.9% |
| Mean | 11.8% | 12.6% |
| Median | 11.7% | 11.3% |
| Interquartile 25% (IQ1) | 9.6% | 6.9% |
| Interquartile 75% (IQ3) | 14.1% | 17.4% |
| Interquartile Range (IQR) | 4.5% | 10.5% |
| Standard Deviation (Sample) | 4.9% | 7.0% |
| Standard Deviation (Population) | 4.8% | 7.0% |
Demographics Similar to Immigrants from Lithuania and Soviet Union by Child Poverty Under the Age of 5
In terms of child poverty under the age of 5, the demographic groups most similar to Immigrants from Lithuania are Tongan (14.2%, a difference of 0.49%), Asian (14.0%, a difference of 0.93%), Cypriot (14.0%, a difference of 0.93%), Immigrants from Indonesia (14.3%, a difference of 1.7%), and Immigrants from Asia (14.4%, a difference of 2.1%). Similarly, the demographic groups most similar to Soviet Union are Immigrants from Greece (14.7%, a difference of 0.0%), Immigrants from Philippines (14.7%, a difference of 0.13%), Immigrants from Belarus (14.7%, a difference of 0.16%), Immigrants from Australia (14.6%, a difference of 0.28%), and Eastern European (14.6%, a difference of 0.57%).
| Demographics | Rating | Rank | Child Poverty Under the Age of 5 |
| Asians | 99.9 /100 | #24 | Exceptional 14.0% |
| Cypriots | 99.9 /100 | #25 | Exceptional 14.0% |
| Immigrants | Lithuania | 99.9 /100 | #26 | Exceptional 14.1% |
| Tongans | 99.9 /100 | #27 | Exceptional 14.2% |
| Immigrants | Indonesia | 99.8 /100 | #28 | Exceptional 14.3% |
| Immigrants | Asia | 99.8 /100 | #29 | Exceptional 14.4% |
| Cambodians | 99.8 /100 | #30 | Exceptional 14.4% |
| Koreans | 99.8 /100 | #31 | Exceptional 14.4% |
| Immigrants | Sri Lanka | 99.8 /100 | #32 | Exceptional 14.4% |
| Taiwanese | 99.8 /100 | #33 | Exceptional 14.5% |
| Immigrants | Moldova | 99.8 /100 | #34 | Exceptional 14.5% |
| Latvians | 99.8 /100 | #35 | Exceptional 14.5% |
| Maltese | 99.8 /100 | #36 | Exceptional 14.5% |
| Turks | 99.7 /100 | #37 | Exceptional 14.6% |
| Eastern Europeans | 99.7 /100 | #38 | Exceptional 14.6% |
| Norwegians | 99.7 /100 | #39 | Exceptional 14.6% |
| Immigrants | Australia | 99.7 /100 | #40 | Exceptional 14.6% |
| Immigrants | Belarus | 99.7 /100 | #41 | Exceptional 14.7% |
| Soviet Union | 99.7 /100 | #42 | Exceptional 14.7% |
| Immigrants | Greece | 99.7 /100 | #43 | Exceptional 14.7% |
| Immigrants | Philippines | 99.7 /100 | #44 | Exceptional 14.7% |