Immigrants from Lithuania vs Soviet Union In Labor Force | Age 45-54
COMPARE
Immigrants from Lithuania
Soviet Union
In Labor Force | Age 45-54
In Labor Force | Age 45-54 Comparison
Immigrants from Lithuania
Soviet Union
83.9%
IN LABOR FORCE | AGE 45-54
99.8/ 100
METRIC RATING
28th/ 347
METRIC RANK
83.0%
IN LABOR FORCE | AGE 45-54
76.8/ 100
METRIC RATING
144th/ 347
METRIC RANK
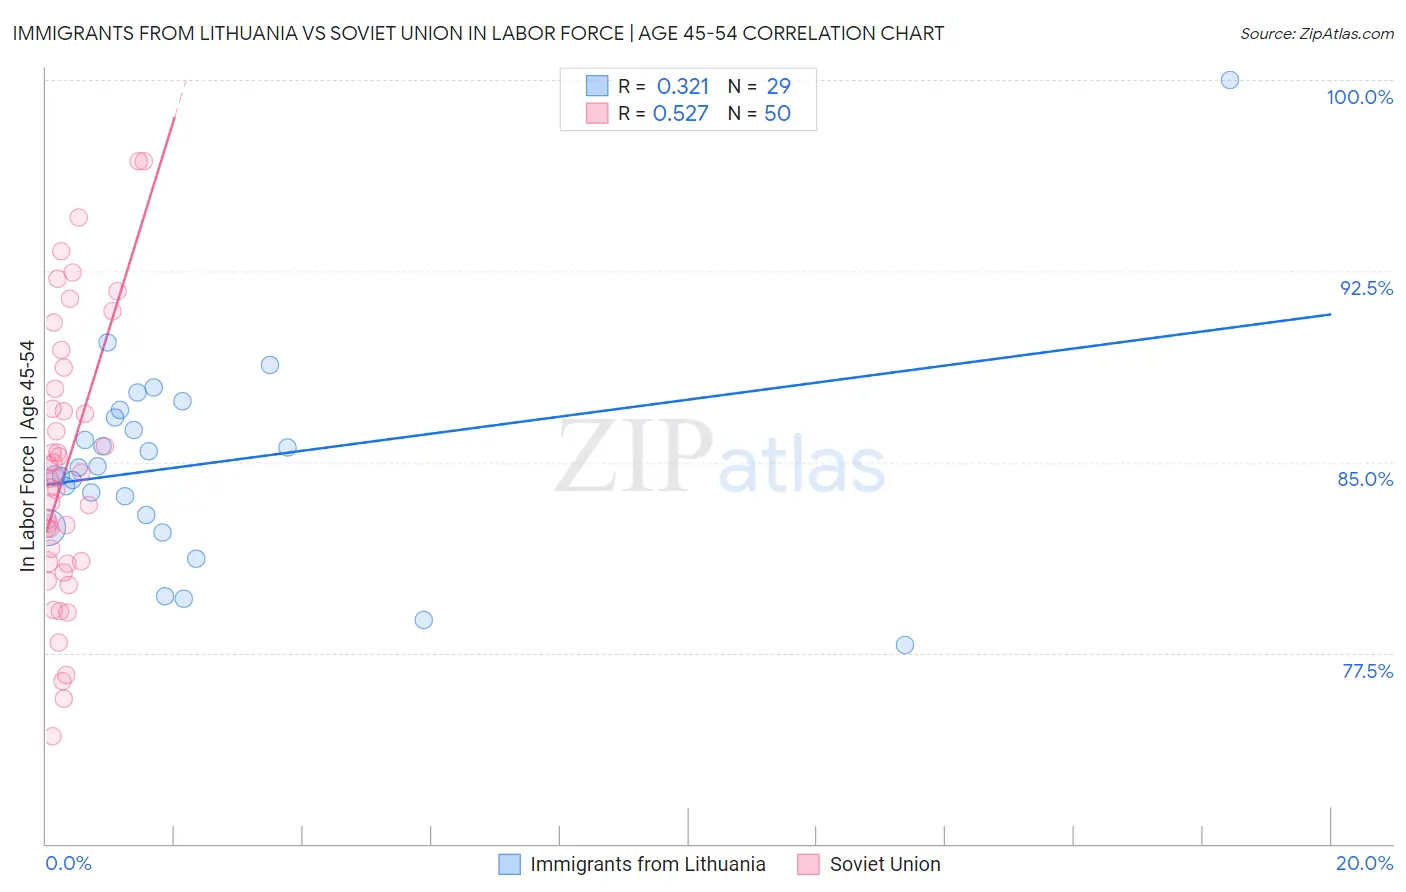
Immigrants from Lithuania vs Soviet Union In Labor Force | Age 45-54 Correlation Chart
The statistical analysis conducted on geographies consisting of 117,719,055 people shows a mild positive correlation between the proportion of Immigrants from Lithuania and labor force participation rate among population between the ages 45 and 54 in the United States with a correlation coefficient (R) of 0.321 and weighted average of 83.9%. Similarly, the statistical analysis conducted on geographies consisting of 43,509,630 people shows a substantial positive correlation between the proportion of Soviet Union and labor force participation rate among population between the ages 45 and 54 in the United States with a correlation coefficient (R) of 0.527 and weighted average of 83.0%, a difference of 1.1%.
In Labor Force | Age 45-54 Correlation Summary
| Measurement | Immigrants from Lithuania | Soviet Union |
| Minimum | 77.8% | 74.2% |
| Maximum | 100.0% | 96.8% |
| Range | 22.2% | 22.6% |
| Mean | 84.9% | 84.8% |
| Median | 84.8% | 84.4% |
| Interquartile 25% (IQ1) | 82.7% | 81.1% |
| Interquartile 75% (IQ3) | 86.9% | 87.9% |
| Interquartile Range (IQR) | 4.2% | 6.8% |
| Standard Deviation (Sample) | 4.1% | 5.4% |
| Standard Deviation (Population) | 4.1% | 5.3% |
Similar Demographics by In Labor Force | Age 45-54
Demographics Similar to Immigrants from Lithuania by In Labor Force | Age 45-54
In terms of in labor force | age 45-54, the demographic groups most similar to Immigrants from Lithuania are Immigrants from Brazil (83.9%, a difference of 0.010%), Immigrants from Serbia (83.9%, a difference of 0.020%), Immigrants from Pakistan (83.8%, a difference of 0.020%), Immigrants from North Macedonia (83.9%, a difference of 0.030%), and Immigrants from Bulgaria (83.8%, a difference of 0.040%).
| Demographics | Rating | Rank | In Labor Force | Age 45-54 |
| Immigrants | Sri Lanka | 99.8 /100 | #21 | Exceptional 83.9% |
| Immigrants | Ireland | 99.8 /100 | #22 | Exceptional 83.9% |
| Tlingit-Haida | 99.8 /100 | #23 | Exceptional 83.9% |
| Slovenes | 99.8 /100 | #24 | Exceptional 83.9% |
| Immigrants | North Macedonia | 99.8 /100 | #25 | Exceptional 83.9% |
| Immigrants | Serbia | 99.8 /100 | #26 | Exceptional 83.9% |
| Immigrants | Brazil | 99.8 /100 | #27 | Exceptional 83.9% |
| Immigrants | Lithuania | 99.8 /100 | #28 | Exceptional 83.9% |
| Immigrants | Pakistan | 99.7 /100 | #29 | Exceptional 83.8% |
| Immigrants | Bulgaria | 99.7 /100 | #30 | Exceptional 83.8% |
| Immigrants | Eritrea | 99.7 /100 | #31 | Exceptional 83.8% |
| Turks | 99.7 /100 | #32 | Exceptional 83.8% |
| Latvians | 99.7 /100 | #33 | Exceptional 83.8% |
| Kenyans | 99.5 /100 | #34 | Exceptional 83.7% |
| Brazilians | 99.5 /100 | #35 | Exceptional 83.7% |
Demographics Similar to Soviet Union by In Labor Force | Age 45-54
In terms of in labor force | age 45-54, the demographic groups most similar to Soviet Union are Okinawan (83.0%, a difference of 0.0%), Immigrants from Haiti (83.0%, a difference of 0.010%), Immigrants from Scotland (83.0%, a difference of 0.010%), Scandinavian (83.0%, a difference of 0.020%), and Yugoslavian (83.0%, a difference of 0.020%).
| Demographics | Rating | Rank | In Labor Force | Age 45-54 |
| Immigrants | Spain | 80.4 /100 | #137 | Excellent 83.0% |
| Ghanaians | 79.5 /100 | #138 | Good 83.0% |
| Scandinavians | 78.5 /100 | #139 | Good 83.0% |
| Yugoslavians | 78.3 /100 | #140 | Good 83.0% |
| Immigrants | Haiti | 77.9 /100 | #141 | Good 83.0% |
| Immigrants | Scotland | 77.8 /100 | #142 | Good 83.0% |
| Okinawans | 77.0 /100 | #143 | Good 83.0% |
| Soviet Union | 76.8 /100 | #144 | Good 83.0% |
| Romanians | 75.4 /100 | #145 | Good 83.0% |
| Immigrants | France | 75.3 /100 | #146 | Good 83.0% |
| Czechoslovakians | 74.8 /100 | #147 | Good 83.0% |
| Immigrants | Nigeria | 74.1 /100 | #148 | Good 83.0% |
| Immigrants | Sweden | 73.3 /100 | #149 | Good 82.9% |
| Immigrants | Netherlands | 72.6 /100 | #150 | Good 82.9% |
| Koreans | 71.9 /100 | #151 | Good 82.9% |